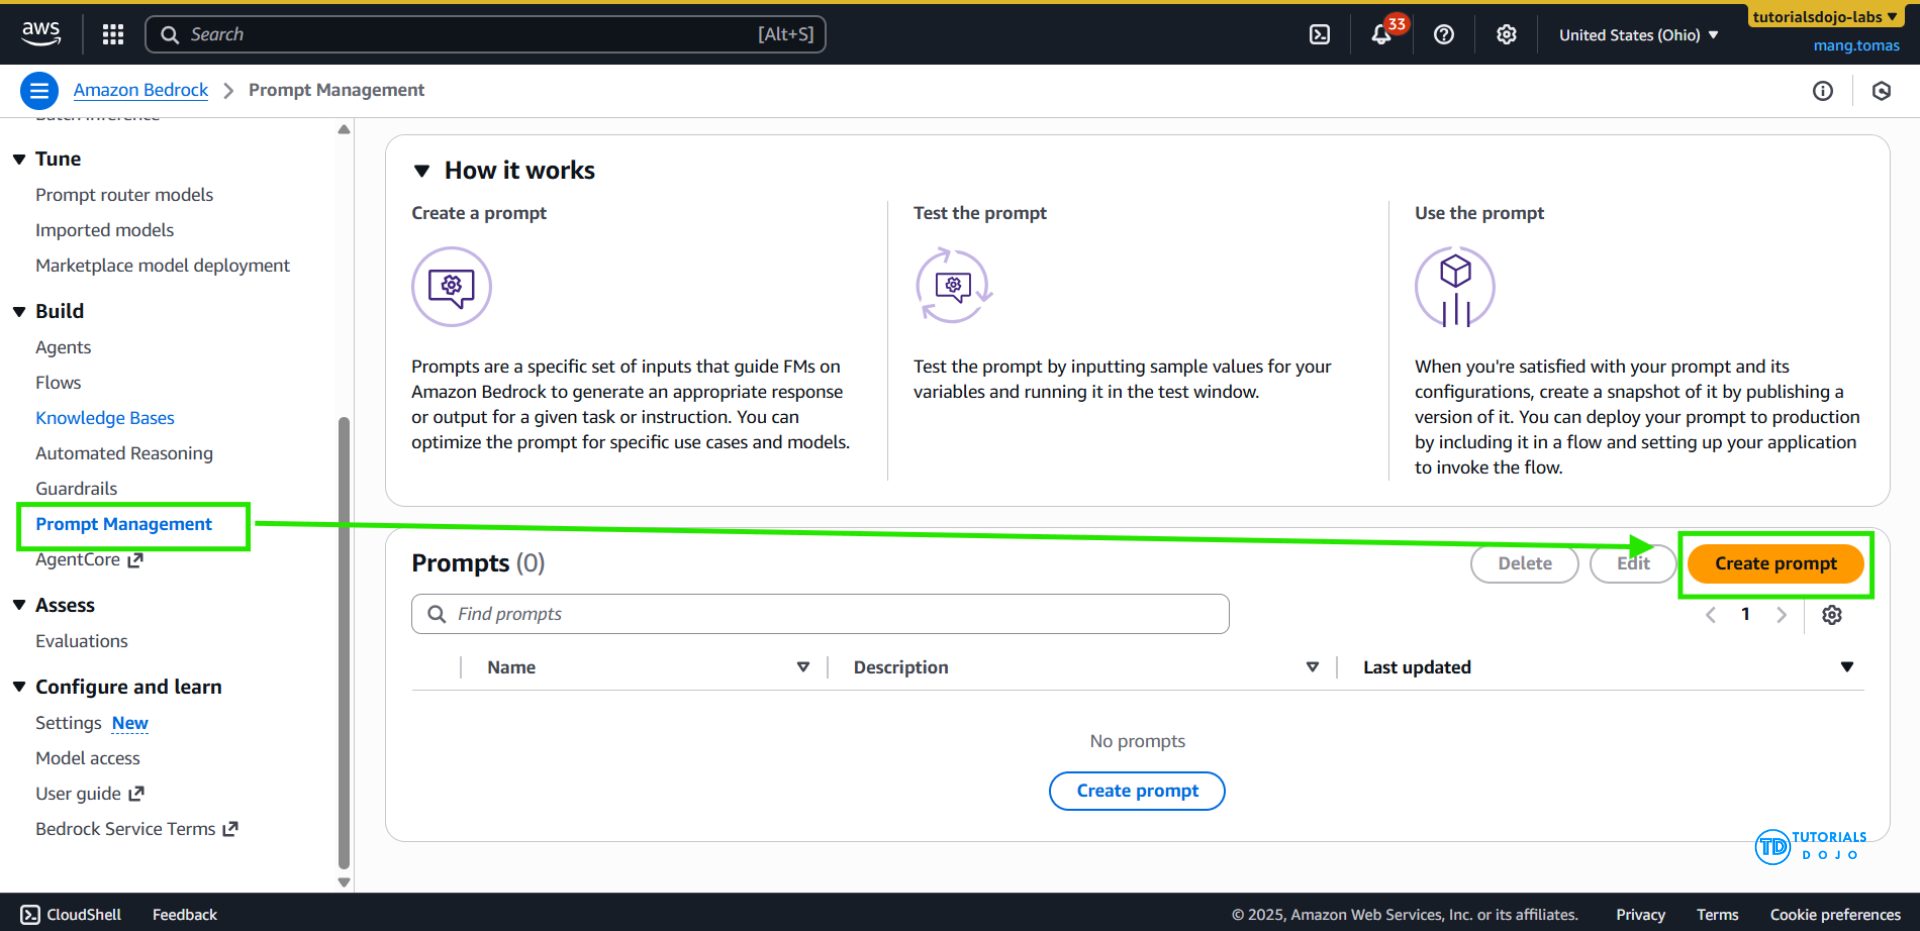
Amazon Bedrock Prompt Management
- a centralized approach to creating, storing, and maintaining prompt templates that can be reused across multiple applications and workflows.
- define structured prompt templates with variables, version each iteration of the prompt, and adjust model inference parameters such as
temperature,top_p, ormax_tokens. - Reusable prompts may be stored
- Allows sharing of specialized prompts across applications
- Be versioned
- Prompts may include variables – placeholders for some value
- Enclose them in double curly braces
- Make me a music playlist for {{genre}} music with {{number}} songs
- pass in structured user input to an application.
- Prompt Variants can be used for different models, inference configurations, or whatever
- The Prompt Builder tool in the Bedrock console lets you play with it
- You may associate Tools and Caching with a prompt
- After testing, deployed prompts may be used within a Flow
- [ 🧐QUESTION🧐 ] standardized, version-controlled, and reusable prompt templates across multiple clinical workflows. Model parameters such as
temperatureandmax_tokensmust also be adjustable depending on the query complexity.- Amazon Kendra complements this workflow by serving as an intelligent search service that indexes structured and unstructured documents. Kendra uses natural language search capabilities to return highly relevant documents, making it ideal for retrieval-augmented generation (RAG) patterns. When integrated with Bedrock, Kendra provides contextual information that can be inserted into prompt templates before invoking a foundation model. This retrieval layer ensures that responses generated by the model are grounded in accurate, domain-specific content, which is especially critical in regulated sectors such as healthcare.
- Amazon Bedrock’s foundation model invocation API enables developers to send prompts, context, and inference parameters directly to a hosted model, eliminating the need to manage any underlying infrastructure. Developers can utilize various model families available in Bedrock, including models from AWS and third-party providers, to generate natural-language responses tailored to the organization’s needs. By combining Prompt Management with the InvokeModel API, teams can implement consistent, scalable generative AI systems while maintaining fine-grained control over how each prompt is executed.
- These services support a robust architecture for building clinical or enterprise assistants. Amazon Kendra enables precise content retrieval, Amazon Bedrock foundation models generate safe and informative responses, and Bedrock Prompt Management standardizes prompts across workflows.
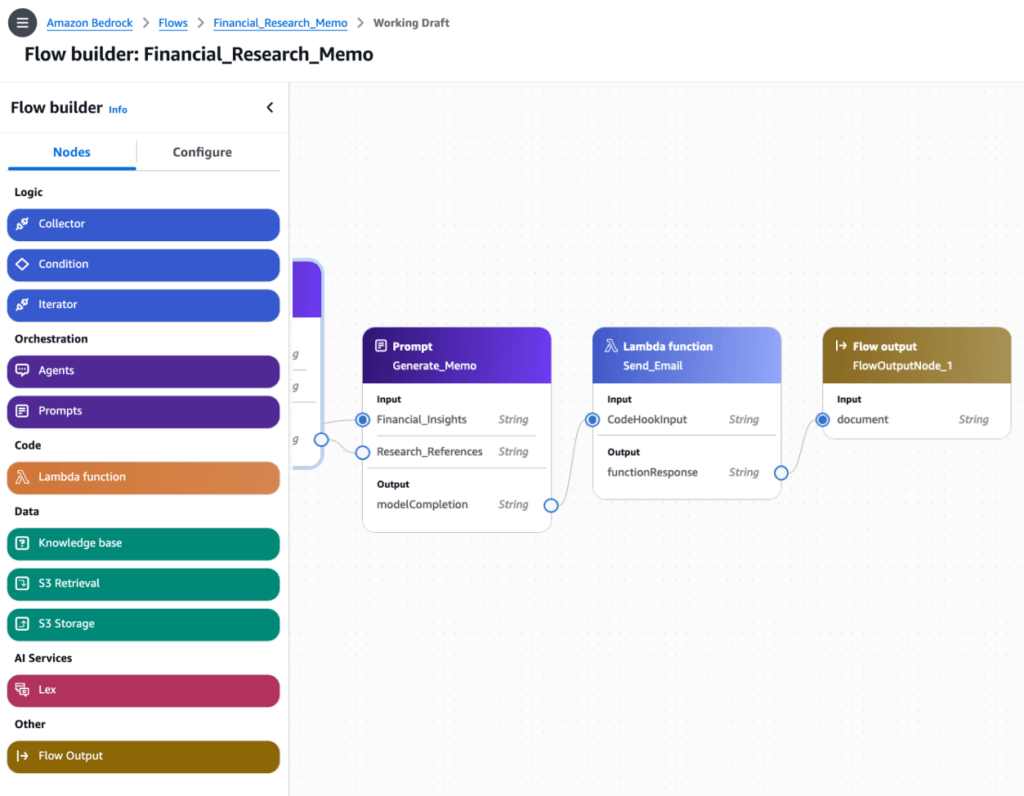
Amazon Bedrock (Prompt) Flows
- A Flow consists of Nodes and Connections between them
- Connections may be conditional
- Flows may be generated visually with Flow Builder
- Or defined via JSON through the API
- Stored prompts may be used as flow components
- You could chain them together to do more complicated things using conditions
- Flows can enforce pre and post-processing on the inputs and outputs
- accelerates the creation, testing, and deployment of user-defined workflows for generative AI applications through an intuitive visual builder. You can seamlessly drag, drop and link Prompts, Agents, Knowledge bases, Guardrails, Lex, Lambda, other AWS services, with business logic to create a workflow. This removes the need to write code and offers easy customization of the business logic. You can also create and updates flows using APIs or AWS Cloud Development Kit.
- test your flows directly in the console for faster iteration with built-in traceability of inputs and outputs. Once a flow is ready, you can version the flow and integrate it into your generative AI application. The versioning capability on flows enables an easy rollback mechanism, and A/B testing. You can invoke the flow via an API call to integrate with your application without the need to deploy and manage your own infrastructure.
- Prompt Flows is primarily intended for orchestrating multi-step generative AI workflows, connecting retrieval, transformation, and inference components. While powerful, Prompt Flows does not replace Prompt Management when the objective is to govern prompt templates centrally.
Bedrock Agent Tracing
- Every Agent response includes a trace
- Shows its “reasoning” process
- What knowledge bases did it hit, what did it get back
- How did it use action groups
- Error details
- Different trace types:
- PreProcessing – categorizing user input
- Orchestration – Calling action groups and knowledge bases
- PostProcessing – Collect final response
- CustomOrchestration – Determining order of actions
- RoutingClassifier – How it classified and routed the request
- Failure – Why a step failed
- Guardrail – What your guardrails did
FM Evaluation Techniques
- ROUGE
- Set of metrics for:
- Text summarization
- Machine translation
- Counts number of overlapping “units” between computer-generated output and evaluation ground-truth output.
- Words, n-grams, sentence fragments
- ROUGE-N
- Overlap on n-grams (how many words at a time are compared)
- ROUGE-1: unigrams (one word,) ROUGE-2: bigrams (two words)
- ROUGE-L
- Uses longest common subsequence between generated and reference text
- Good at evaluating coherence and order of narrative
- Set of metrics for:
- BLEU
- Used for machine translation
- Compares machine translation to human translation
- Measure PRECISION of N-grams
- As opposed to ROUGE, which is recall
- Precision compares to everything, recall just to “relevant” results (overlapping results in the case of ROUGE)
- Checks how many words / phrases appear in the reference translation
- Works at the sentence level
- Brevity penalty
- Overly short translations are penalized
- Limited use in assessing fluency and grammar
- BERTscore
- LLM’s rely on “embeddings” that score the meaning of a word as a vector
- BERTscore uses these embedding vectors to compare the semantic similarity between a model’s output and the ideal output
- BERT is a language model that predated GPT
- • Less sensitive to synonyms and paraphrasing that dont really change the meaning of what’s being generated
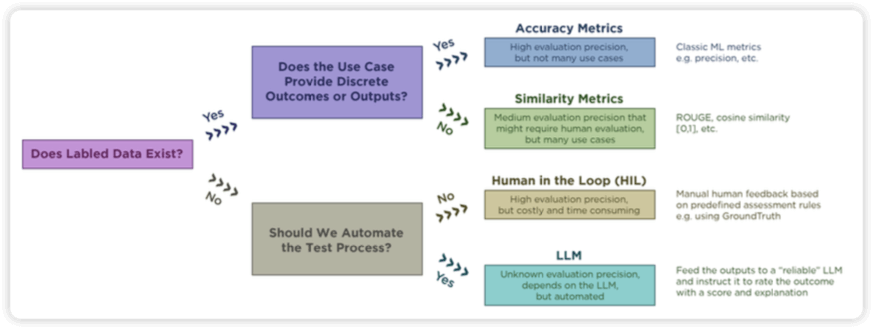
- Bedrock Model Evaluations
- Automatic model evaluations
- Tons of built-in task types, datasets, and metrics
- Text generation, summarization, Q&A, classification
- Human-based
- Humans compare two models
- Given your prompt dataset
- Set up a work team in Cognito, SageMaker Ground Truth, or Amazon Augmented AI
- Humans compare two models
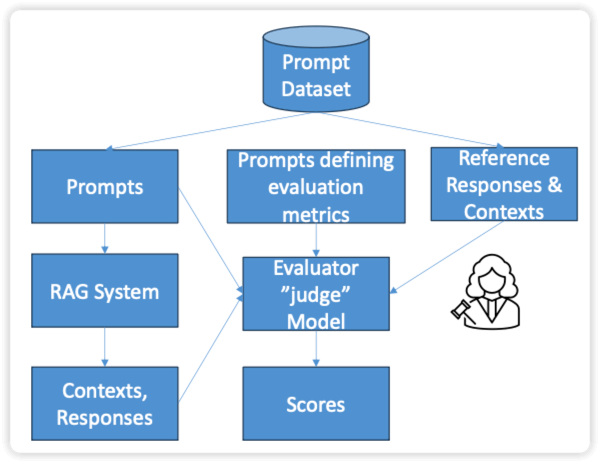
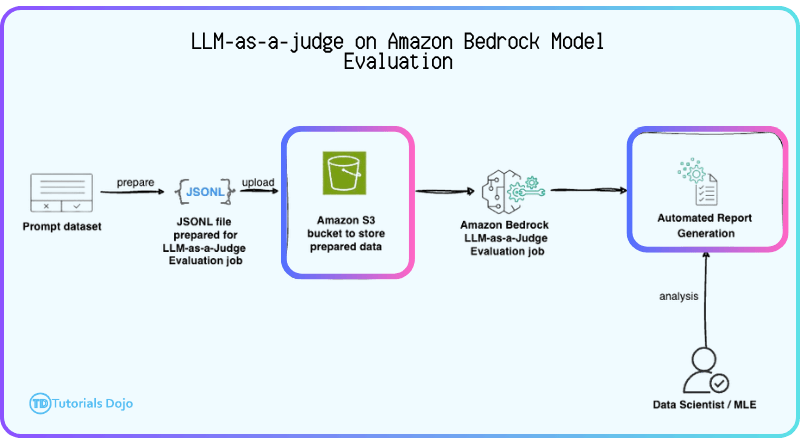
- LLM as a judge (LLM-as-a-judge)
- Evaluator model and generator model
- A prompt dataset needed
- support custom metrics
- allowing organizations to define evaluation criteria that reflect specific business requirements, such as writing style, formality, or brand voice, rather than relying only on built-in metrics like correctness or completeness. Custom metric definitions are configured when creating an evaluation job and the results are stored in a designated location, such as an S3 bucket.
- When combined with other AWS ML services such as Amazon Rekognition and Amazon Translate, LLM-as-a-judge can incorporate visual analysis, multilingual accuracy, and contextual signals into the evaluation process.
- RAG evaluation jobs
- Retrieve only – measures retrieval from your RAG source
- Relevance and coverage
- Retrieve and generate – Measures the response as well
- Correctness, completeness, helpfulness, logical coherence, etc.
- Provide a prompt dataset in S3 in JSON line format
- Retrieve only – measures retrieval from your RAG source
- Automatic model evaluations
| Task type | Metric | Built-in datasets | Computed metric |
|---|---|---|---|
| General text generation | Accuracy | TREX | Real world knowledge (RWK) score |
| Robustness | BOLD | Word error rate | |
| TREX | |||
| WikiText2 | |||
| Toxicity | RealToxicityPrompts | Toxicity | |
| BOLD | |||
| Text summarization | Accuracy | Gigaword | BERTScore |
| Toxicity | Gigaword | Toxicity | |
| Robustness | Gigaword | BERTScore and deltaBERTScore | |
| Question and answer | Accuracy | BoolQ | NLP-F1 |
| NaturalQuestions | |||
| TriviaQA | |||
| Robustness | BoolQ | F1 and deltaF1 | |
| NaturalQuestions | |||
| TriviaQA | |||
| Toxicity | BoolQ | Toxicity | |
| NaturalQuestions | |||
| TriviaQA | |||
| Text classification | Accuracy | Women’s Ecommerce Clothing Reviews | Accuracy (Binary accuracy from classification_accuracy_score) |
| Robustness | Women’s Ecommerce Clothing Reviews | classification_accuracy_score and delta_classification_accuracy_score |
- [ 🧐QUESTION🧐 ] The steps for evaluating chatbot accuracy in text generation
- Start the automatic model evaluation using Amazon Bedrock: The first step is to initiate the automatic evaluation within Amazon Bedrock, where the model undergoes testing based on its text generation capabilities. This is the foundational step for evaluating the chatbot’s overall accuracy.
- Use the TREX dataset for general text generation: The TREX dataset is specifically used to evaluate the chatbot’s ability to generate accurate, real-world responses. It includes queries that test the factual accuracy of the chatbot, making it ideal for measuring how well the model handles domain-specific questions, such as product details, availability, and compatibility. Using this dataset helps identify whether the chatbot’s responses are grounded in factual knowledge, which is essential for improving accuracy.
- Assess the chatbot’s performance using the Real World Knowledge (RWK) score: After using the T‑REx dataset, Amazon Bedrock calculates the Real World Knowledge (RWK) score. This score quantifies how accurately the chatbot handles complex, real-world knowledge in its responses. A high RWK score indicates that the model is accurately processing domain-specific queries, while a low score signals areas where improvements are needed. This score provides critical insights into the chatbot’s accuracy, especially when it comes to domain-specific topics.
- [ NOT ] using the WikiText-2 dataset, which intended for evaluating the fluency and robustness of the model’s text generation capabilities
- [ 🧐QUESTION🧐 ] evaluation of models on consistent with the company’s style guidelines (adhere to the company-specific tone and formality)
- When evaluating with a judge model, Bedrock processes a prompt dataset (typically stored in S3) that contains input prompts and optionally reference outputs. Each item is scored according to the chosen metrics, whether built-in or custom, and the evaluation job produces both per-prompt results and aggregated summaries. This setup enables automated, repeatable scoring at scale while providing detailed insights into model performance.
- Developing a human-validated evaluation dataset ensures that evaluation inputs are representative of real organizational use cases and domain-specific content. When combined with Bedrock’s custom metrics, this allows outputs to be assessed on nuanced attributes such as tone, formality, and adherence to corporate guidelines. Custom metrics are configured via
AutomatedEvaluationCustomMetricConfig, which specifies the metric definitions, evaluator model configuration, and expected output schema. By pairing representative data with custom metrics and LLM-as-a-judge, teams can conduct meaningful, repeatable evaluations that reflect real business requirements, rather than relying on generic benchmarks or purely subjective feedback.
- [ 🧐QUESTION🧐 ] quantitatively evaluate the model’s output across these closely related prompt variations
- The evaluation job produces structured reports and quantitative metrics—such as variance, robustness scores, and consistency indicators—without requiring custom logic, manual text comparison, or external tooling. These results directly fulfill the requirement of analyzing output stability using a reproducible, quantitative method. Because the evaluation is fully integrated into Amazon Bedrock, it aligns with best practices for grounded AI evaluation and ensures the analysis can be repeated consistently as new versions of the assistant or prompt templates evolve.
- By supplying a structured prompt dataset containing clusters of similar queries, the evaluation job can compute robustness metrics, which measure statistical variance in the model’s outputs across related prompts.
Responsible AI
- Fairness: Considering impacts on different groups of stakeholders.
- Explainability: Understanding and evaluating system outputs.
- Privacy and security: Appropriately obtaining, using, and protecting data and models.
- Safety: Reducing harmful system output and misuse.
- Controllability: Having mechanisms to monitor and steer AI system behavior.
- Veracity and robustness: Achieving correct system outputs, even with unexpected or adversarial inputs.
- Governance: Incorporating best practices into the AI supply chain, including providers and deployers.
- Transparency: Enabling stakeholders to make informed choices about their engagement with an AI system.
- Tools
- Amazon Bedrock
- Model evaluation tools
- SageMaker Clarify
- Bias detection
- Model evaluation
- Explainability
- SageMaker Model Monitor
- Get alerts for inaccurate responses
- Amazon Augmented AI
- Insert humans in the loop to help correct results
- SageMaker ML Governance
- SageMaker Role Manager
- Model
- Model Dashboard
- Amazon Bedrock
CloudWatch
- Log groups: arbitrary name, usually representing an application
- Log stream: instances within application / log files / containers
- Can define log expiration policies (never expire, 1 day to 10 years…)
- CloudWatch Logs can send logs to:
- Amazon S3 (exports)
- Kinesis Data Streams
- Kinesis Data Firehose
- AWS Lambda
- OpenSearch
- Logs are encrypted by default
- Can setup KMS-based encryption with your own keys
- Sources
- SDK, CloudWatch Logs Agent, CloudWatch Unified
Agent - Elastic Beanstalk: collection of logs from application
- ECS: collection from containers
- AWS Lambda: collection from function logs
- VPC Flow Logs: VPC specific logs
- API Gateway
- CloudTrail based on filter
- Route53: Log DNS queries
- SDK, CloudWatch Logs Agent, CloudWatch Unified
- CloudWatch Logs Insights
- Search and analyze log data stored in CloudWatch Logs
- Example: find a specific IP inside a log, count occurrences of “ERROR” in your logs…
- Provides a purpose-built query language
- Automatically discovers fields from AWS services and JSON log events
- Fetch desired event fields, filter based on conditions, calculate aggregate statistics, sort events, limit number of events…
- Can save queries and add them to CloudWatch Dashboards
- Can query multiple Log Groups in different AWS accounts
- It’s a query engine, not a real-time engine
- S3 Export
- Log data can take up to 12 hours to become available for export
- The API call is CreateExportTask
- Not near-real time or real-time… use Logs Subscriptions instead
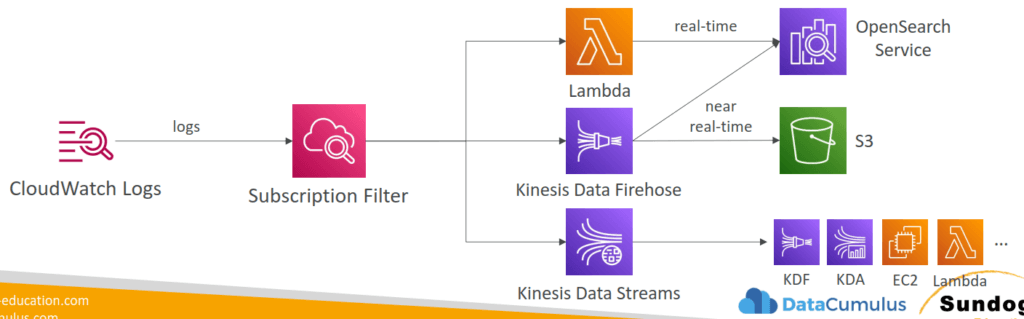
- CloudWatch Logs Subscriptions
- Get a real-time log events from CloudWatch Logs for processing and analysis
- Send to Kinesis Data Streams, Kinesis Data Firehose, or Lambda
- Subscription Filter – filter which logs are events delivered to your destination
- CloudWatch Alarms
- Alarms are used to trigger notifications for any metric
- Various options (sampling, %, max, min, etc…)
- Alarm States:
- OK
- INSUFFICIENT_DATA
- ALARM
- Period:
- Length of time in seconds to evaluate the metric
- High resolution custom metrics: 10 sec, 30 sec or multiples of 60 sec
- Targets
- Stop, Terminate, Reboot, or Recover an EC2 Instance
- Trigger Auto Scaling Action
- Send notification to SNS (from which you can do pretty much anything)
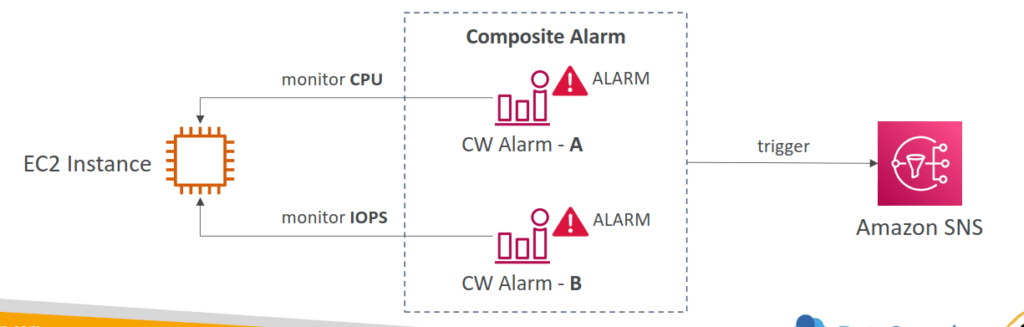
- Composite Alarms
- Composite Alarms are monitoring the states of multiple other alarms
- AND and OR conditions
- Helpful to reduce “alarm noise” by creating complex composite alarms
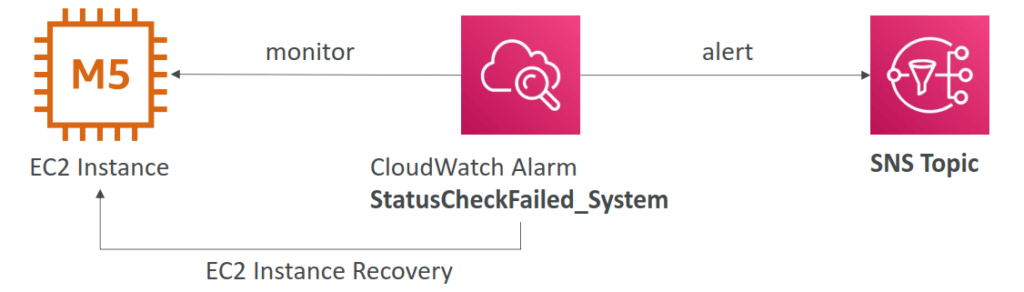
- CASE: EC2 Instance Recovery
- Status Check:
- Instance status = check the EC2 VM
- System status = check the underlying hardware
- Attached EBS status = check attached EBS volumes
- Recovery: Same Private, Public, Elastic IP, metadata, placement group
- Status Check:
- Alarms can be created based on CloudWatch Logs Metrics Filters
- To test alarms and notifications, set the alarm state to Alarm using CLI
aws cloudwatch set-alarm-state --alarm-name "myalarm" --state-value ALARM --state-reason "testing purposes"
- CloudWatch and GenAI
- Testing prompt regression
- CloudWatch logs
- Prompt inputs and model responses
- Foundational to monitoring and troubleshooting
- Monitor KPI’s
- Prompt effectiveness / response quality
- Latency
- Error rates
- Other Monitors
- Foundation model interaction tracing
- Business impact metrics
- Prompt effectiveness
- Hallucination rates
- Anomaly detection
- Token burst patterns
- Response drift
- Bedrock model invocation logs
- Cost anomaly detection
- CloudWatch Real User Monitoring (RUM)
- Mostly for testing mobile apps (iOS or Android)
- Measures page load times, errors, app launch times, etc.
- From a real user session
- Integrates with Application Signals
- View results in X-Ray traces
- Relevant for measuring end to end performance of your mobile GenAI apps
- Mostly for testing mobile apps (iOS or Android)
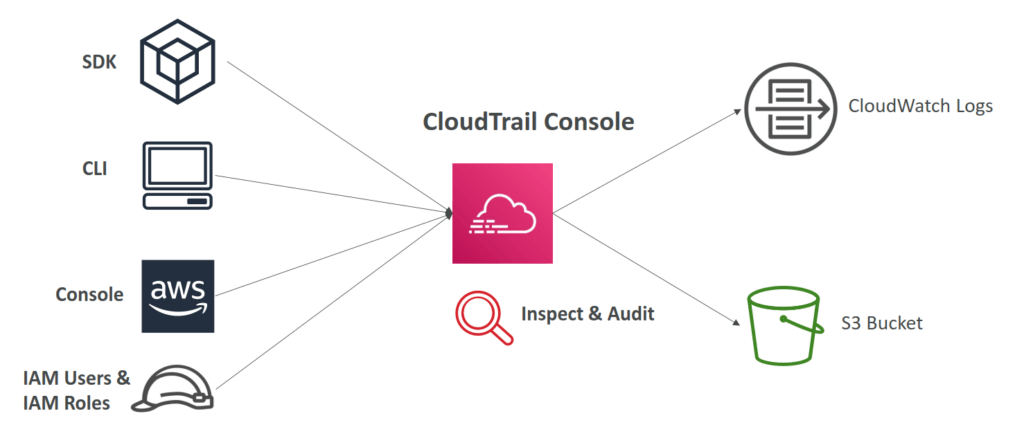
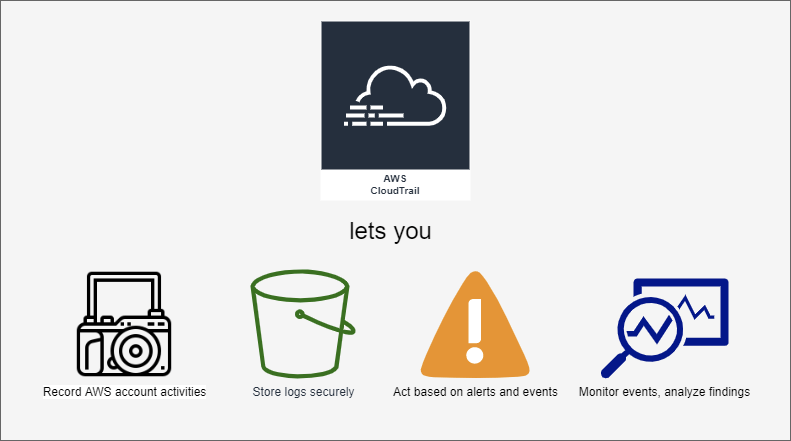
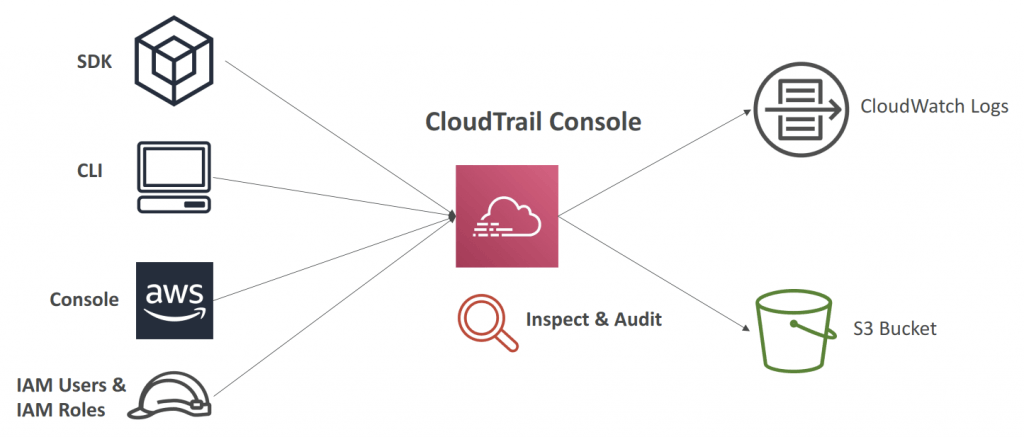
AWS CloudTrail
- Provides governance, compliance and audit for your AWS Account
- CloudTrail is enabled by default!
- Get an history of events / API calls made within your AWS Account by:
- Console
- SDK
- CLI
- AWS Services
- Can put logs from CloudTrail into CloudWatch Logs or S3
- A trail can be applied to All Regions (default) or a single Region.
- If a resource is deleted in AWS, investigate CloudTrail first!
- CloudTrail Events
- Management Events:
- Operations that are performed on resources in your AWS account
- Examples:
- Configuring security (IAM AttachRolePolicy)
- Configuring rules for routing data (Amazon EC2 CreateSubnet)
- Setting up logging (AWS CloudTrail CreateTrail)
- By default, trails are configured to log management events.
- Can separate Read Events (that don’t modify resources) from Write Events (that may modify resources)
- Data Events:
- By default, data events are not logged (because high volume operations)
- Amazon S3 object-level activity (ex: GetObject, DeleteObject, PutObject): can separate Read and Write Events
- AWS Lambda function execution activity (the Invoke API)
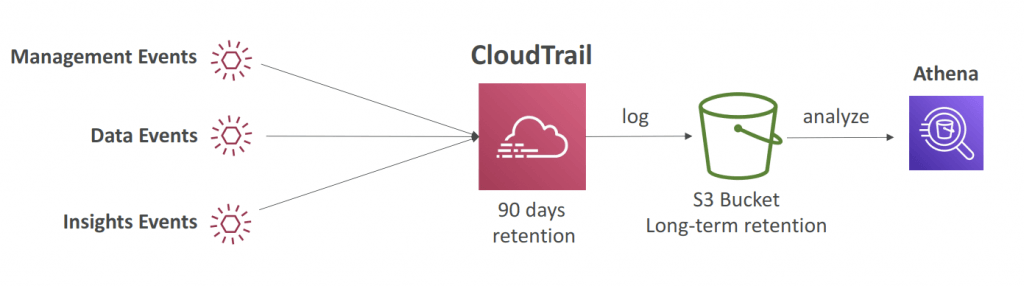
- Retention
- Events are stored for 90 days in CloudTrail
- To keep events beyond this period, log them to S3 and use Athena
- Management Events:
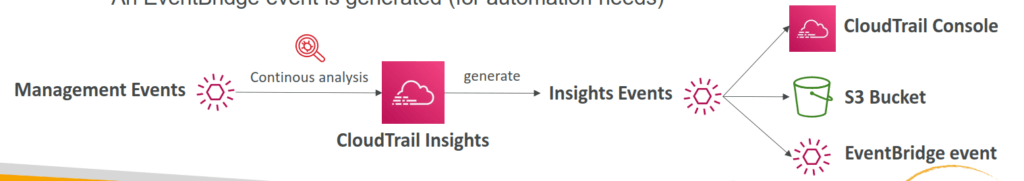
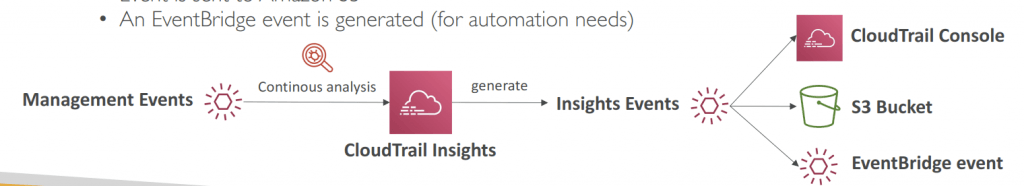
- CloudTrail Insights
- Enable CloudTrail Insights to detect unusual activity in your account:
- inaccurate resource provisioning
- hitting service limits
- Bursts of AWS IAM actions
- Gaps in periodic maintenance activity
- CloudTrail Insights analyzes normal management events to create a baseline
- And then continuously analyzes write events to detect unusual patterns
- Anomalies appear in the CloudTrail console
- Event is sent to Amazon S3
- An EventBridge event is generated (for automation needs)
- Enable CloudTrail Insights to detect unusual activity in your account:
- Audit an history of events / API calls made by users / services / AWS console, under AWS account(s)
- CloudTrail is enabled by default!
- export logs to CloudWatch Logs or S3
- A trail can be applied to All Regions (default) or a single Region.
- If a resource is deleted in AWS, investigate CloudTrail first!
- Event Type
- Management Events (default enabled)
- also known as “control plane operations”
- Operations that are performed on resources in your AWS account
- Examples:
- Configuring security (IAM AttachRolePolicy)
- Configuring rules for routing data (Amazon EC2 CreateSubnet)
- Setting up logging (AWS CloudTrail CreateTrail)
- By default, trails are configured to log management events.
- Can separate Read Events (that don’t modify resources) from Write Events (that may modify resources)
- Data Events (default disabled):
- also known as “data plane operations”
- By default, data events are not logged (because high volume operations)
- Amazon S3 object-level activity (ex: GetObject, DeleteObject, PutObject): can separate Read and Write Events
- AWS Lambda function execution activity (the Invoke API)
- Insights Events:
- to detect unusual activities (by analyze “Write” events)
- inaccurate resource provisioning
- hitting service limits
- Bursts of AWS IAM actions
- Gaps in periodic maintenance activity
- CloudTrail Insights analyzes normal management events to create a baseline
- And then continuously analyzes write events to detect unusual patterns
- Anomalies appear in the CloudTrail console
- Event is sent to Amazon S3
- An EventBridge event is generated (for automation needs)
- to detect unusual activities (by analyze “Write” events)
- Management Events (default enabled)
- Event Retention as 90 days. Can be export to S3 and use Athena for further analysis.
- CloudTrail and GenAI
- CloudTrail can track all API calls to Amazon Bedrock
- Audit trails of which prompts were used
- When and by who
- This is often a compliance requirement
- CloudTrail can track all API calls to Amazon Bedrock
- CloudTrail log file integrity validation
- Validated log files are invaluable in security and forensic investigations.
- When you enable log file integrity validation, CloudTrail creates a hash for every log file that it delivers. Every hour, CloudTrail also creates and delivers a file that references the log files for the last hour and contains a hash of each. This file is called a digest file. CloudTrail signs each digest file using the private key of a public and private key pair. After delivery, you can use the public key to validate the digest file. CloudTrail uses different key pairs for each AWS region.
- The digest files are delivered to the same Amazon S3 bucket associated with your trail as your CloudTrail log files. If your log files are delivered from all regions or from multiple accounts into a single Amazon S3 bucket, CloudTrail will deliver the digest files from those regions and accounts into the same bucket.
- The digest files are put into a folder separate from the log files. This separation of digest files and log files enables you to enforce granular security policies and permits existing log processing solutions to continue to operate without modification. Each digest file also contains the digital signature of the previous digest file if one exists. The signature for the current digest file is in the metadata properties of the digest file Amazon S3 object.
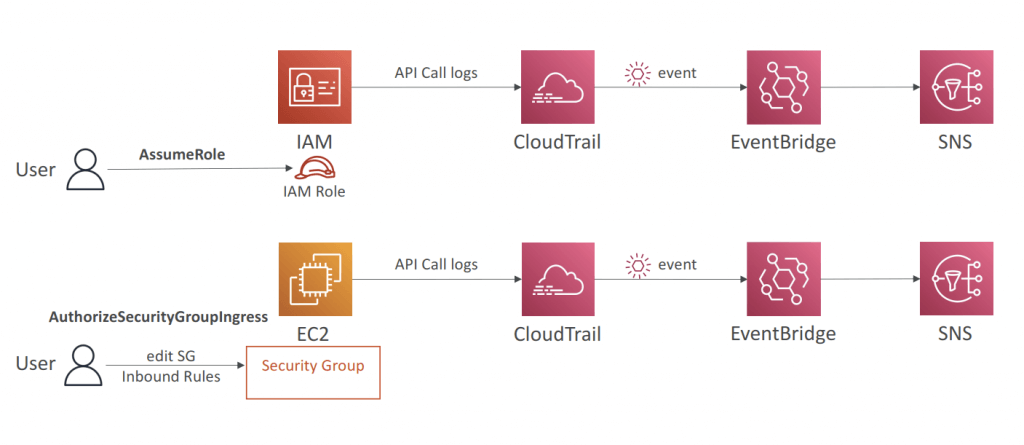
- [ 🧐QUESTION🧐 ] notified of any S3 bucket policy changes
- Create an AWS CloudTrail trail that sends logs to an Amazon CloudWatch log group. Create a CloudWatch Metric Filter on the log group for S3 bucket policy events. Create an Alarm that will notify you whenever this metric threshold is reached.
- A CloudTrail trail is required since it will send its logs to a CloudWatch Log group. To create an alarm, you must first create a metric filter and then configure an alarm based on the filter.
- For notification, you will then create a CloudWatch Alarm for this Metric with a threshold of >=1 and set your email as a notification recipient. Even a single S3 bucket event on the log group will trigger this alarm and should send you a notification.
- S3 Server access logging is primarily used to provide detailed records for the requests that are made to a bucket. Each access log record provides details about a single access request, such as the requester, bucket name, request time, request action, response status, and an error code, if relevant. It is more appropriate to use CloudWatch or CloudTrail to track the S3 bucket policy changes.
- can’t directly send the S3 server access logs to CloudWatch logs. You need to use CloudTrail to send the events to a log group before you can create a metric and alarm for those events.
- can’t simply use an EventBridge rule to filter your log groups directly
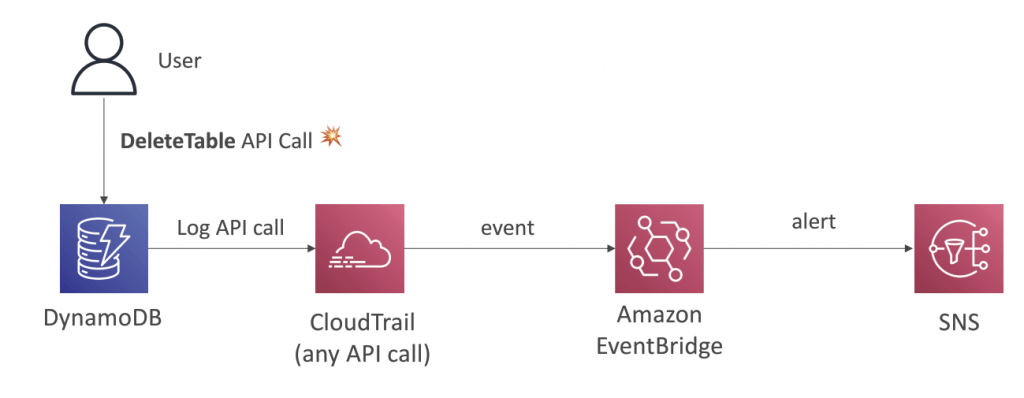
- [ 🧐QUESTION🧐 ] to search and review the actions on specific s3 buckets (Get, Put, Delete…) for auditing purposes
- You can log the object-level API operations on your S3 buckets. Before Amazon EventBridge can match these events, you must use AWS CloudTrail to set up a trail configured to receive these events. To log data events for an S3 bucket to AWS CloudTrail and EventBridge, create a trail. A trail captures API calls and related events in your account and delivers the log files to an S3 bucket that you specify. After you create a trail and configure it to capture the log files you want, you need to be able to find the log files and interpret the information they contain.
- Typically, log files appear in your bucket within 15 minutes of the recorded AWS API call or other AWS event. Then you need to create a Lambda function to log data events for your S3 bucket. Finally, you need to create a trigger to run your Lambda function in response to an Amazon S3 data event. You can create this rule on Amazon EventBridge and setting Lambda function as the target. Your logs will show up on the CloudWatch log group, which you can view and search as needed.
X-Ray
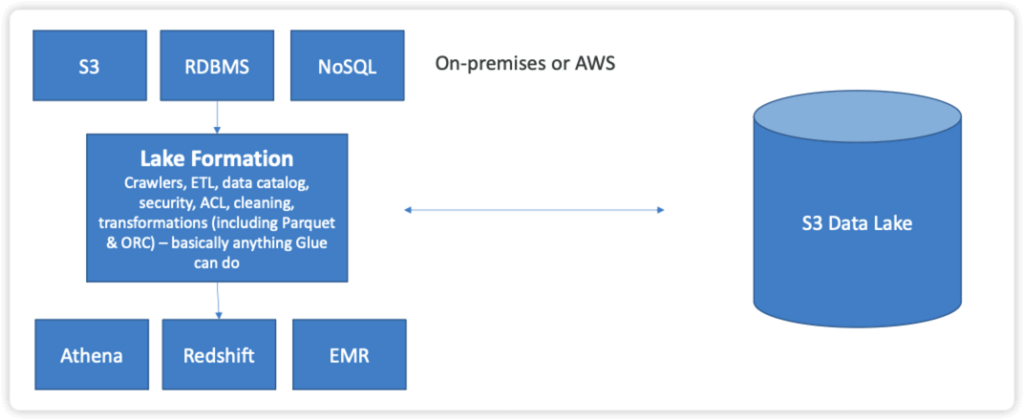
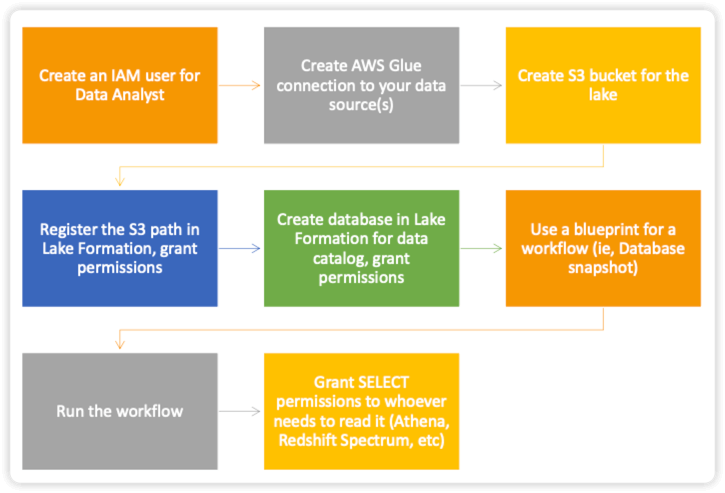
AWS Lake Formation
- Loading data & monitoring data flows
- Setting up partitions
- Encryption & managing keys
- Defining transformation jobs & monitoring them
- Access control
- Auditing
- Built on top of Glue
- Finer Points:
- Cross-account Lake Formation permission
- Recipient must be set up as a data lake administrator
- Can use AWS Resource Access Manager for accounts external to your organization
- IAM permissions for cross-account access
- Lake Formation does not support manifests in Athena or Redshift queries
- IAM permissions on the KMS encryption key are needed for encrypted data catalogs in Lake Formation
- IAM permissions needed to create blueprints and workflows
- Cross-account Lake Formation permission
- Governed Tables and Security
- supports “Governed Tables” that support ACID transactions across multiple tables
- New type of S3 table
- Can’t change choice of governed afterwards
- Works with streaming data too (Kinesis)
- Can query with Athena
- Storage Optimization with Automatic Compaction
- Granular Access Control with Row and Cell-Level Security
- Both for governed and S3 tables
- supports “Governed Tables” that support ACID transactions across multiple tables
- Data Permissions
- Can tie to IAM users/roles, SAML, or external AWS accounts
- Can use policy tags on databases, tables, or columns
- Can select specific permissions for tables or columns
- Data Filters
- Column, row, or cell-level security
- Apply when granting SELECT permission on tables
- “All columns” + row filter = row-level security
- “All rows” + specific columns = column-level security
- Specific columns + specific rows = cell-level security
- Create filters via the console or via CreateDataCellsFilter API.
- Lake Formation Tag-Based Access Control (LF-TBAC) is an authorization strategy that assigns permissions based on specific attributes known as LF-Tags in Lake Formation. You can attach LF-Tags to Data Catalog resources and grant permissions to Lake Formation principals for those resources using these tags. Lake Formation permits operations on these resources only when the principal has access to a tag value that matches the resource’s tag value.
Bedrock uses the InvocationLogsConfig object to configure how logging behaves. This includes options for logging only prompts, only responses, or both. Additionally, you can specify which logging destination to use: Amazon S3, CloudWatch Logs, or both. Logging to S3 allows long-term retention and structured storage of gzipped JSON files containing prompt-response pairs and metadata. Each file is organized to facilitate querying with Amazon Athena, AWS Glue, making it ideal for detailed post-processing or compliance reporting. Logging to CloudWatch provides near-real-time monitoring and analytics via CloudWatch Logs Insights, enabling rapid identification of anomalies in model behavior.
For extensive requests or responses, Bedrock can store oversized data as separate objects in S3 while still including metadata in the main log file. This ensures that logs remain manageable while preserving access to full content. In streaming scenarios, logging captures the sequence of streamed events, enabling reconstruction of the full session. This is particularly valuable for chatbots or other interactive applications that may send multiple messages in a single session.
When used with AWS Lambda and Amazon API Gateway, Bedrock invocation logging integrates seamlessly without requiring application-level changes. Lambda functions can continue to call the InvokeModel API usually, while Bedrock handles the logging of both prompts and responses. This decouples observability from the application logic, reducing complexity and ensuring consistent capture of all interactions. Logs stored in S3 or CloudWatch can then be analyzed to identify trends, detect anomalous outputs, or generate audit trails, which is critical for regulated environments.
Bedrock model invocation logging supports multiple use cases beyond basic debugging. It allows teams to audit AI decisions, analyze usage patterns, and prepare datasets for fine-tuning or model distillation. By preserving every prompt and response, organizations can improve model accuracy, detect bias, and meet regulatory requirements. Additionally, combining invocation logs with analytics services like Amazon Athena or OpenSearch provides actionable insights into model behavior at scale. This makes it an essential feature for professional-grade generative AI deployments.