AWS CloudWatch
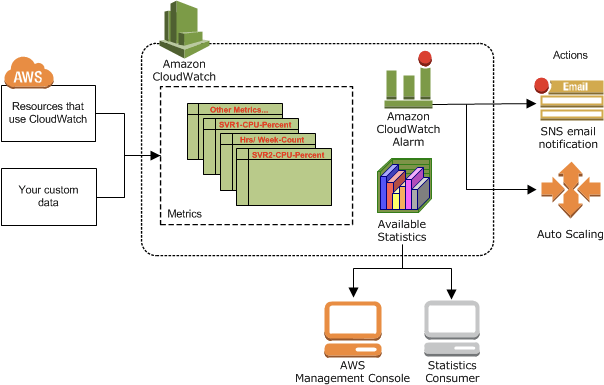
- Metrics: is a variable to monitor (CPUUtilization, NetworkIn…); Collect and track key metrics for every AWS services
- namespace (specify a namespace for each data point, as new metric)
- dimension is an attributes (instance id, environment, …)
- Up to 30 dimensions per metric
- timestamps
- for EC2 memory
- CloudWatch does not monitor the memory, swap, and disk space utilization of your instances. If you need to track these metrics, you can install a CloudWatch agent in your EC2 instances.
- (EC2) Memory usage is a custom metric, using API PutMetricData
- for Lambda function
- The ConcurrentExecutions metric in Amazon CloudWatch explicitly measures the number of instances of a Lambda function that are running at the same time.
- detailed monitoring, just shorten the period to 1-minute; no extra fields
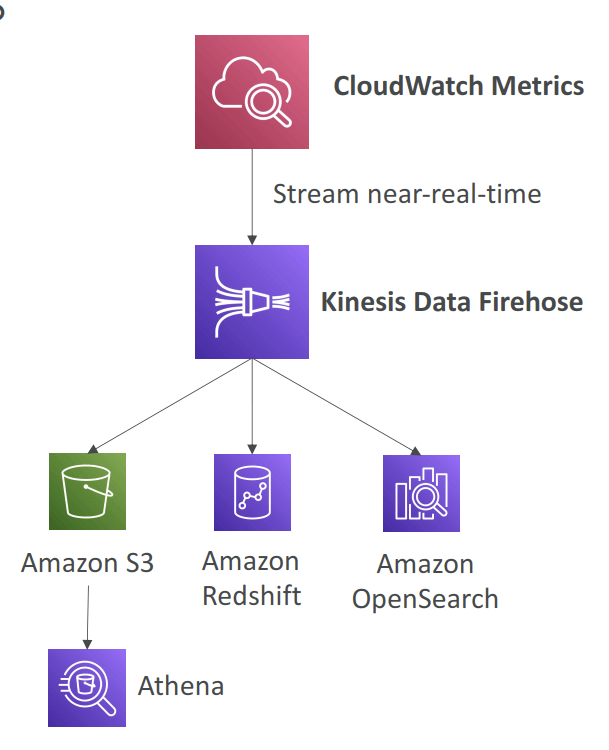
- Metric Streams
- near-real-time delivery
- Option to filter metrics to only stream a subset of them
- Custom Metrics
- Use API call PutMetricData
- Ability to use dimensions (attributes) to segment metrics
- Instance.id
- Environment.name
- Metric resolution (StorageResolution API parameter – two possible value):
- Standard: 1 minute (60 seconds)
- High Resolution: 1/5/10/30 second(s) – Higher cost
- Important: Accepts metric data points two weeks in the past and two hours in the future
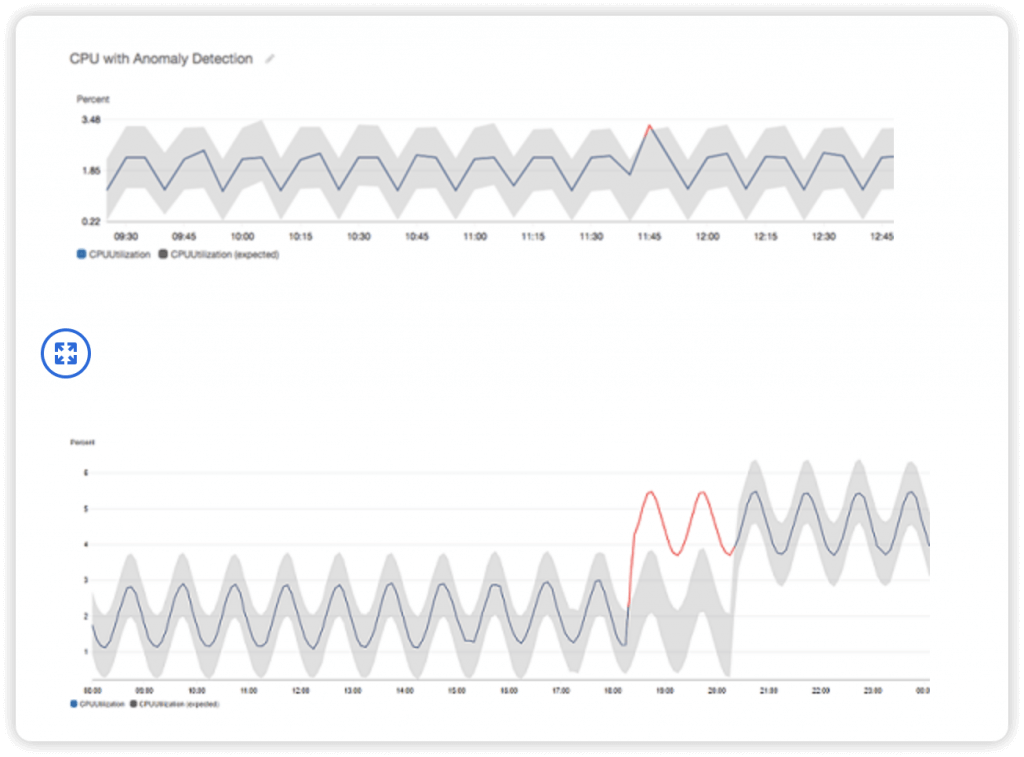
- Anomaly Detection
- Continuously analyze metrics to determine normal baselines and surface anomalies using ML algorithms
- It creates a model of the metric’s expected values (based on metric’s past data)
- Shows you which values in the graph are out of the normal range
- Allows you to create Alarms based on metric’s expected value (instead of Static Threshold)
- Ability to exclude specified time periods or events from being trained
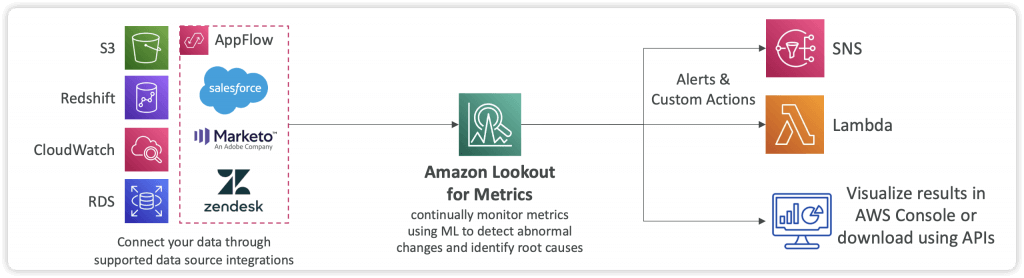
- Amazon Lookout for Metrics (discontinued on SEP 2025)
- Automatically detect anomalies within metrics and identify their root causes using Machine Learning
- It detects and diagnoses errors within your data with no manual intervention
- Integrates with different AWS Services and 3rd party SaaS apps through AppFlow
- Send alerts to SNS, Lambda, Slack, Webhooks…
- Logs: Collect, monitor, analyze and store log files
- group – arbitrary name, usually representing an application (to encrpyt with custom KMS keys, need to use CloudWatch Logs API)
- stream – instances within application / log files / containers
- export
- Amazon S3, may take up to 12 hour, with API CreateExportTask
- Not near-real time or real-time
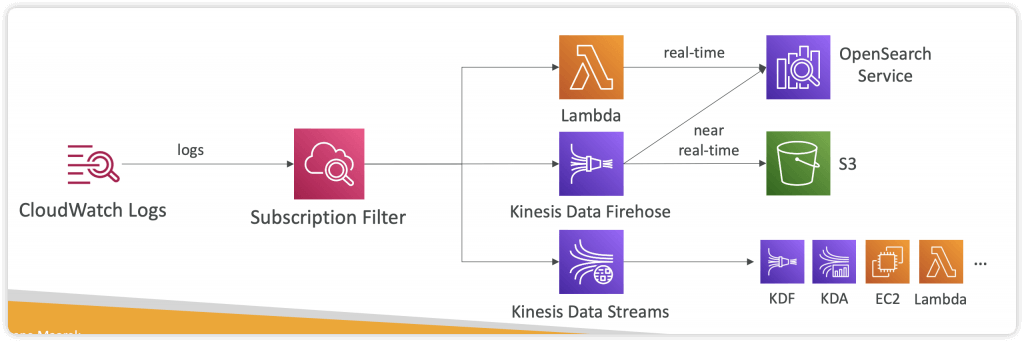
- Using Logs Subscriptions to export real-time events
- to Kinesis Data Streams, Kinesis Data Firehose, AWS Lambda
- with Subscription Filter
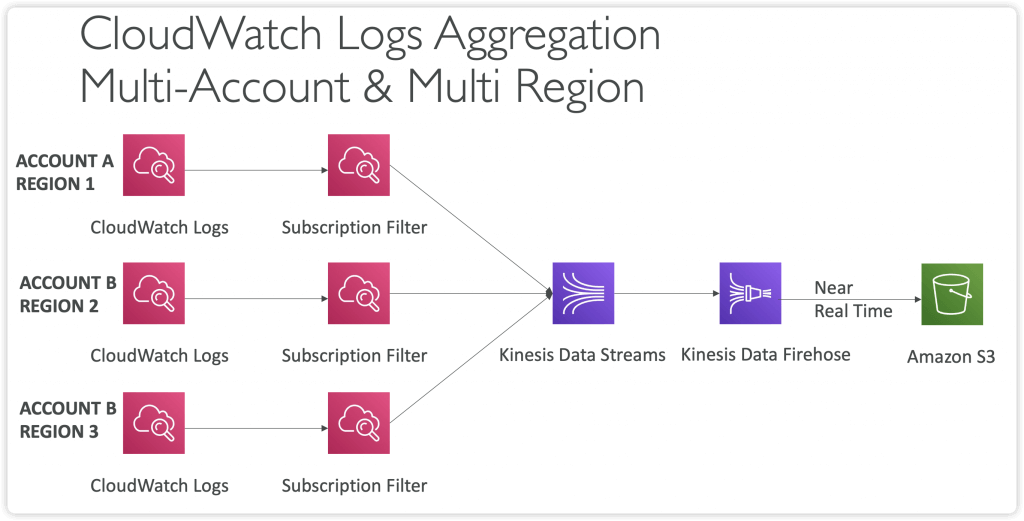
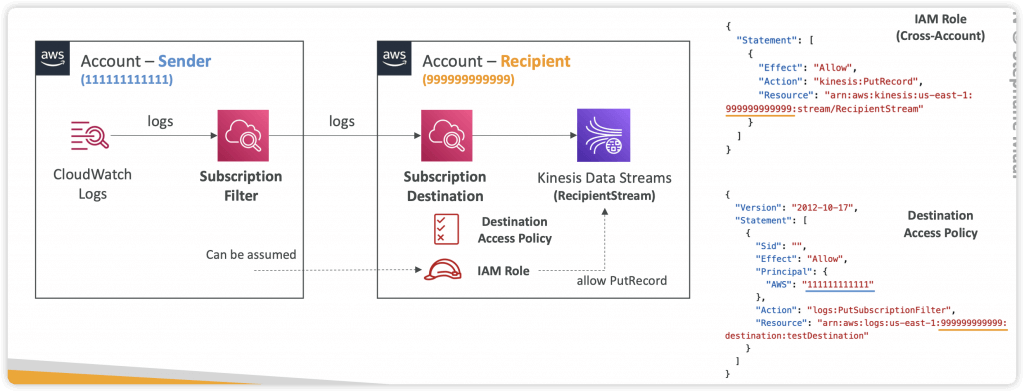
- Cross-Account Subscription (Subscription Filter -> Subscription Destination)
- Cross-Account Subscription – send log events to resources in a different AWS account (KDS, KDF)
- log expiration policies (never expire, 1 day to 10 years…)
- Live Tail – for realtime tail watch
- By default, no logs from EC2 machine to CloudWatch
- CloudWatch Logs Agent – only push logs
- CloudWatch Unified Agent – push logs + collect metrics (extra RAM, Process, Swap) + centralized by SSM Parameter Store
- Metrics
- Collected directly on your Linux server / EC2 instance
- CPU (active, guest, idle, system, user, steal)
- Disk metrics (free, used, total), Disk IO (writes, reads, bytes, iops)
- RAM (free, inactive, used, total, cached)
- Netstat (number of TCP and UDP connections, net packets, bytes)
- Processes (total, dead, bloqued, idle, running, sleep)
- Swap Space (free, used, used %)
- Reminder: out-of-the box metrics for EC2 – disk, CPU, network (high level)
- Collected directly on your Linux server / EC2 instance
- Metrics
- Metric Filters
- Filter expressions
- Metric filters can be used to trigger alarms
- Filters do not retroactively filter data. Filters only publish the metric data points for events that happen after the filter was created.
- • Ability to specify up to 3 Dimensions for the Metric Filter (optional)
- With “aws logs associate-kms-key“, enable (AWS KMS) encryption for an existing log group, eliminating the need to recreate the log group or manually encrypt logs before submission
- Log Insight
- facilitate in-depth analysis of log data
- enables users to run queries on log data collected from various AWS services and applications
- Provides a purpose-built query language
- Automatically discovers fields from AWS services and JSON log
- events
- Fetch desired event fields, filter based on conditions, calculate aggregate statistics, sort events, limit number of events…
- Can save queries and add them to CloudWatch Dashboards
- It’s a query engine, not a real-time engine
- Subscriptions
- get access to a real-time feed of log events from CloudWatch Logs and have it delivered to other services such as an Amazon Kinesis stream, Amazon Data Firehose stream, or AWS Lambda for custom processing, analysis, or loading to other systems.
- A subscription filter defines the filter pattern to use for filtering which log events get delivered to your AWS resource, as well as information about where to send matching log events to.
- CloudWatch Logs also produces CloudWatch metrics about the forwarding of log events to subscriptions. You can use a subscription filter with Kinesis, Lambda, or Data Firehose.
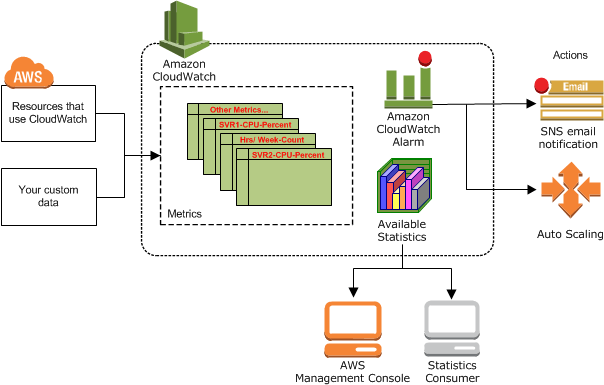
- Alarms: Re-act in real-time to metrics / events
- based on a single metric; Composite Alarms are monitoring on multiple other alarms
- Targets
- EC2
- EC2 ASG action
- Amazon SNS
- Alarm States:
- OK
- INSUFFICIENT_DATA
- ALARM
- Settings
- Period is the length of time to evaluate the metric or expression to create each individual data point for an alarm. It is expressed in seconds. If you choose one minute as the period, there is one datapoint every minute.
- High resolution custom metrics: 10 sec, 30 sec or multiples of 60 sec
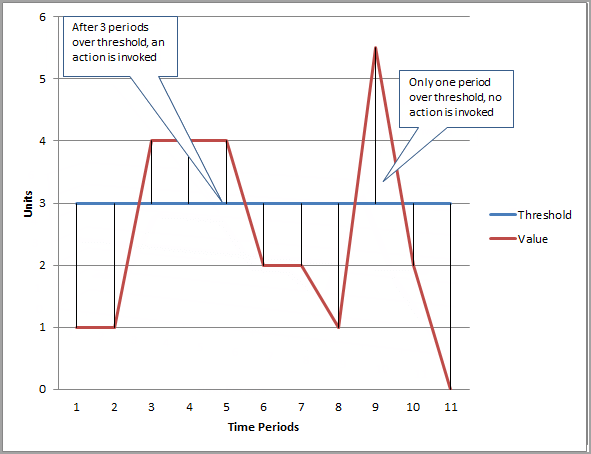
- Evaluation Period is the number of the most recent periods, or data points, to evaluate when determining alarm state.
- Datapoints to Alarm is the number of data points within the evaluation period that must be breaching to cause the alarm to go to the ALARM state. The breaching data points do not have to be consecutive, they just must all be within the last number of data points equal to Evaluation Period.
- Period is the length of time to evaluate the metric or expression to create each individual data point for an alarm. It is expressed in seconds. If you choose one minute as the period, there is one datapoint every minute.
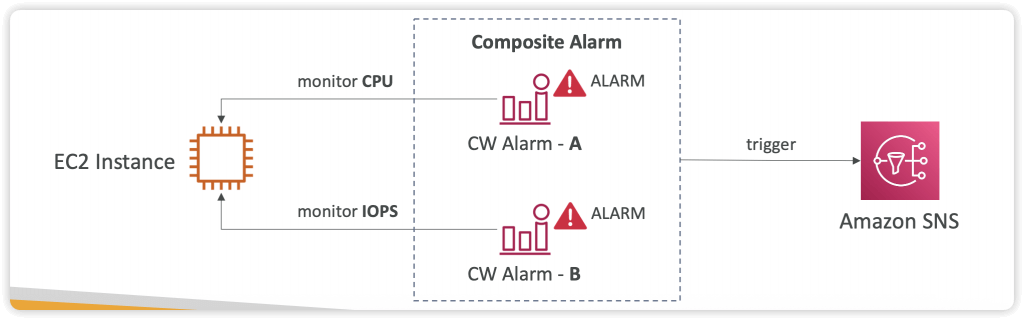
- Composite Alarms
- Composite Alarms are monitoring the states of multiple other alarms
- AND and OR conditions
- To test alarms and notifications, set the alarm state to Alarm using CLI
aws cloudwatch set-alarm-state –alarm-name “myalarm” –state-value ALARM –state-reason “testing purposes”
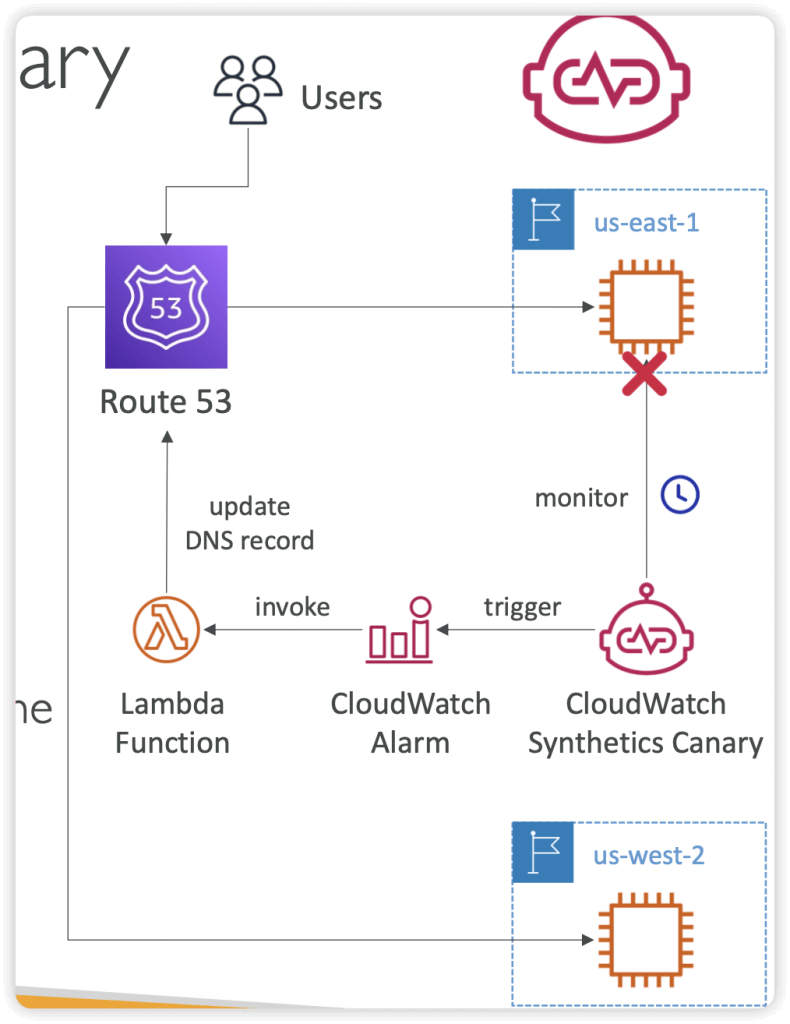
- Synthetics Canary: monitor your APIs, URLs, Websites, …
- Configurable script that monitor your APIs, URLs, Websites…
- Reproduce what your customers do programmatically to find issues before customers are impacted
- Checks the availability and latency of your endpoints and can store load time data and screenshots of the UI
- Integration with CloudWatch Alarms
- Scripts written in Node.js or Python
- Programmatic access to a headless Google Chrome browser
- Can run once or on a regular schedule
- Blueprints
- Heartbeat Monitor – load URL, store screenshot and an HTTP archive file
- API Canary – test basic read and write functions of REST APIs
- Broken Link Checker – check all links inside the URL that you are testing
- Visual Monitoring – compare a screenshot taken during a canary run with a baseline screenshot
- Canary Recorder – used with CloudWatch Synthetics Recorder (record your actions on a website and automatically generates a script for that)
- GUI Workflow Builder – verifies that actions can be taken on your webpage (e.g., test a webpage with a login form)
- Events, now called Amazon EventBridge
- Schedule – cron job
- Event Pattern – rules to react/trigger services
- Event Bus, a router that receives events and delivers them to zero or more destinations, or targets.
- (AWS) default, Partner, Custom
- Schema – the structure template for event (json)
- CloudWatch Evidently
- validate/serve new features to specified % of users only
- Launches (= feature flags) and Experiments (= A/B testing), and Overrides (specific variants assigned to specific user-id)
- evaluation events stored in CloudWatch Logs or S3
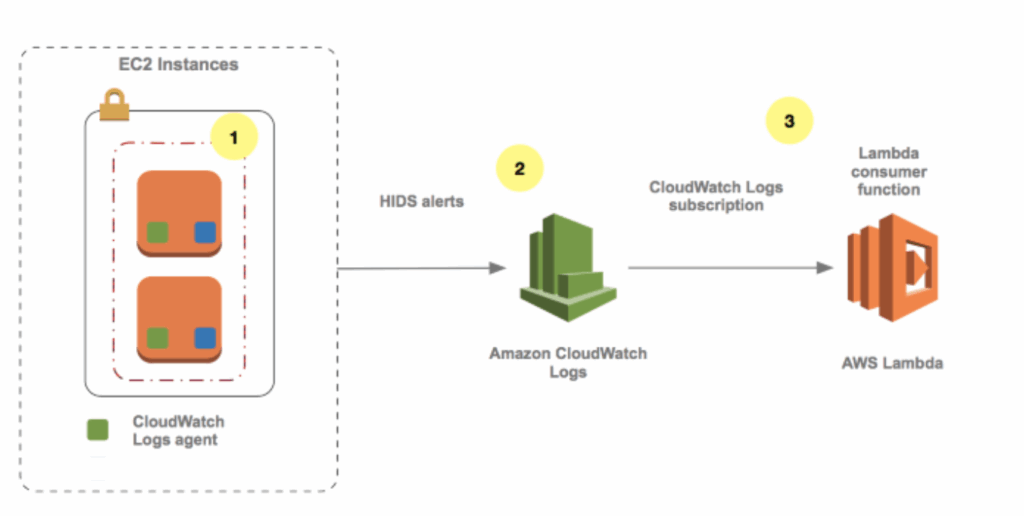
- [ 🧐QUESTION🧐 ] Automation delete any EC2 instance with manual SSH Login
- Set up a CloudWatch Logs subscription with an AWS Lambda function which is configured to add a
FOR_DELETIONtag to the Amazon EC2 instance that produced the SSH login event. Run another Lambda function every day using the Amazon EventBridge rule to terminate all EC2 instances with the custom tag for deletion.- a CloudWatch Logs subscription cannot be directly integrated with an AWS Step Functions application
- using SQS as well as worker instances is unnecessary since you can simply use Lambda functions for processing. In addition, Amazon CloudWatch Alarms can only send notifications to SNS and not SQS.
- Set up a CloudWatch Logs subscription with an AWS Lambda function which is configured to add a
- [ 🧐QUESTION🧐 ] Collect aggregated data from multiple instances
- You can view statistical graphs of your published metrics with the AWS Management Console.
- CloudWatch stores data about a metric as a series of data points. Each data point has an associated timestamp. You can even publish an aggregated set of data points called a statistic set.
- When you have multiple data points per minute, aggregating data minimizes the number of calls to put-metric-data. For example, instead of calling put-metric-data multiple times for three data points that are within 3 seconds of each other, you can aggregate the data into a statistic set that you publish with one call, using the
--statistic-valuesparameter.
- [ 🧐QUESTION🧐 ] Collect on-premise and cloud instances logs also analyse
- The unified CloudWatch agent enables you to do the following:
- Collect more system-level metrics from Amazon EC2 instances across operating systems. The metrics can include in-guest metrics, in addition to the metrics for EC2 instances. The additional metrics that can be collected are listed in Metrics Collected by the CloudWatch Agent.
- Collect system-level metrics from on-premises servers. These can include servers in a hybrid environment as well as servers not managed by AWS.
- Retrieve custom metrics from your applications or services using the
StatsDandcollectdprotocols.StatsDis supported on both Linux servers and servers running Windows Server.collectdis supported only on Linux servers. - Collect logs from Amazon EC2 instances and on-premises servers, running either Linux or Windows Server.
- The logs collected by the unified CloudWatch agent are processed and stored in Amazon CloudWatch Logs, just like logs collected by the older CloudWatch Logs agent.
- Amazon Data Firehose is a service that can be used to capture and automatically load streaming data into destinations like Amazon S3.
- Amazon Athena is an interactive query service that makes it easy to analyze data directly in Amazon Simple Storage Service (Amazon S3) using standard SQL.
- The unified CloudWatch agent enables you to do the following:
AWS Health Dashboard – Service History
- Service History
- Shows all regions, all services health
- Shows historical information for each day
- Has an RSS feed you can subscribe to
- Previously called AWS Service Health Dashboard
- Your Account
- Previously called AWS Personal Health Dashboard (PHD)
- AWS Account Health Dashboard provides alerts and remediation guidance when AWS is experiencing events that may impact you.
- While the Service Health Dashboard displays the general status of AWS services, Account Health Dashboard gives you a personalized view into the performance and availability of the AWS services underlying your AWS resources.
- The dashboard displays relevant and timely information to help you manage events in progress and provides proactive notification to help you plan for scheduled activities.
- Can aggregate data from an entire AWS Organization
- Global service
- Shows how AWS outages directly impact you & your AWS resources
- Alert, remediation, proactive, scheduled activities
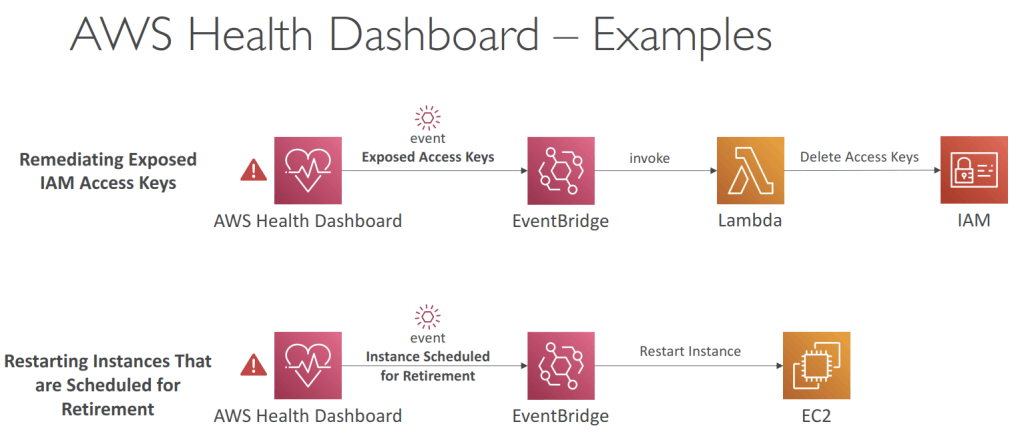
- Health Event Notifications
- Use EventBridge to react to changes for AWS Health events in your AWS account
- Example: receive email notifications when EC2 instances in your AWS account are
scheduled for updates
- Example: receive email notifications when EC2 instances in your AWS account are
- This is possible for Account events (resources that are affected in your account) and Public
Events (Regional availability of a service)- Use cases: send notifications, capture event information, take corrective action…
- Use EventBridge to react to changes for AWS Health events in your AWS account
- Status Checks
- Automated checks to identify hardware and software issues
- System Status Checks
- Monitors problems with AWS systems (software/hardware issues on the physical host, loss of system power, …)
- Check Personal Health Dashboard for any scheduled critical maintenance by AWS to your instance’s host
- Resolution: stop and star t the instance (instance migrated to a new host)
- Instance Status Checks
- Monitors software/network configuration of your instance (invalid network configuration, exhausted memory, …)
- Resolution: reboot the instance or change instance configuration
- Attached EBS Status Checks
- Monitors EBS volumes attached to your instance (reachable & complete I/O Operations)
- Resolution: reboot the instance or replace affected EBS volumes
- CW Metrics & Recovery
- CloudWatch Metrics (1 minute interval)
- StatusCheckFailed_System
- StatusCheckFailed_Instance
- StatusCheckFailed_AttachedEBS
- StatusCheckFailed (for any)
- Option 1: CloudWatch Alarm
- Recover EC2 instance with the same private/public IP, EIP, metadata, and Placement Group
- Send notifications using SNS
- Option 2: Auto Scaling Group
- Set min/max/desired 1 to recover an instance but won’t keep the same private and elastic IP
- CloudWatch Metrics (1 minute interval)
AWS X-Ray
- Troubleshooting (not monitoring) application performance and errors as “centralized service map visualization”
- Request tracking across distributed systems
- Focus on Latency, Errors and Fault analysis
- Compatible
- AWS Lambda
- Elastic Beanstalk
- ECS
- ELB
- API Gateway
- EC2 Instances or any application server (even on premise)
- But X-Ray cannot track the memory and swap usage of the instance; only CloudWatch Agents can do.
- Enable by
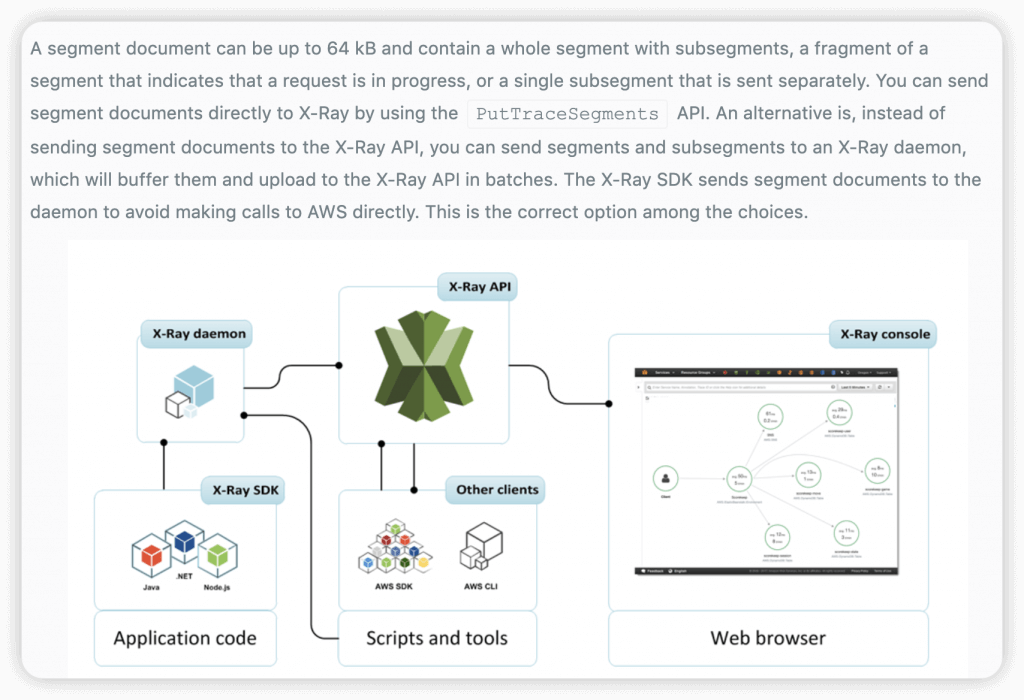
- AWS X-Ray SDK (on applications)
- Install X-Ray daemon (low lv UDP packet interceptor on OS) (on EC2 or ECS)
- a software application that listens for traffic on UDP port 2000, gathers raw segment data, and relays it to the AWS X-Ray API.
- for EC2, X-Ray daemon can be installed via user-data script
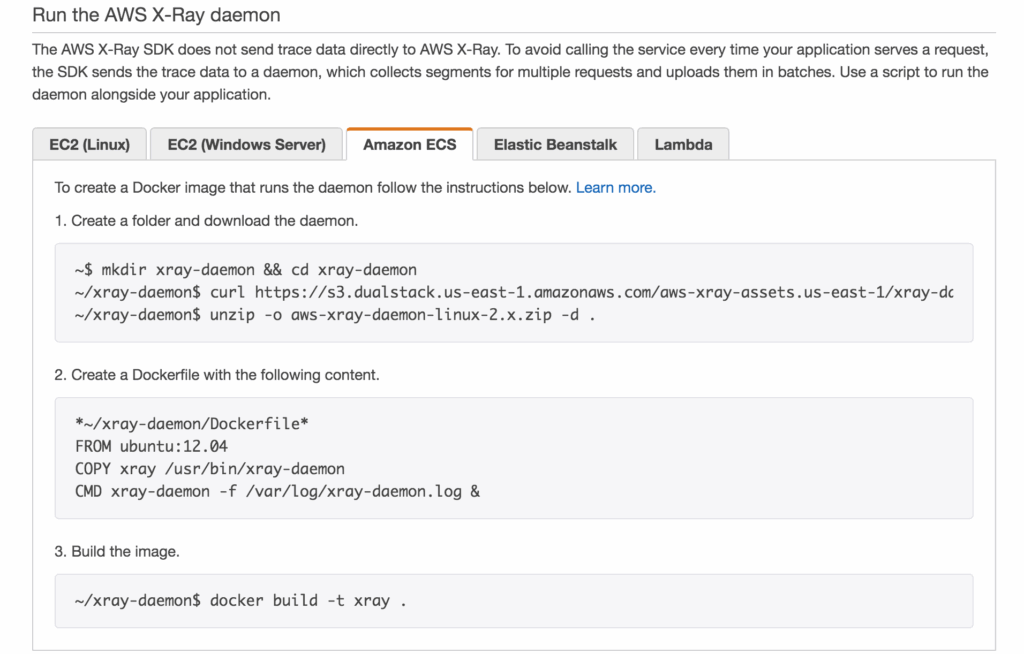
- for ECS, create a Docker image that runs the X-Ray daemon, upload it to a Docker image repository, and then deploy it to your Amazon ECS cluster
- The AWS X-Ray SDK does not send trace data directly to AWS X-Ray. To avoid calling the service every time your application serves a request, the SDK sends the trace data to a daemon, which collects segments for multiple requests and uploads them in batches. Use a script to run the daemon alongside your application.
- To properly instrument your applications in Amazon ECS, you have to create a Docker image that runs the X-Ray daemon, upload it to a Docker image repository, and then deploy it to your Amazon ECS cluster. You can use port mappings and network mode settings in your task definition file to allow your application to communicate with the daemon container.
- The AWS X-Ray daemon is a software application that listens for traffic on UDP port 2000, gathers raw segment data, and relays it to the AWS X-Ray API. The daemon works in conjunction with the AWS X-Ray SDKs and must be running so that data sent by the SDKs can reach the X-Ray service.
- Lambda runs the daemon automatically any time a function is invoked for a sampled request
- Enable X-Ray AWS Integration (IAM Role with proper permission) (on AWS services)
- for ElasticBeanstalk: to enable the X-Ray daemon
- setting an option in the Elastic Beanstalk console
- by including the xray-daemon.config configuration file in the .ebextensions directory of your source code.
- The X-Ray daemon is not provided for Multicontainer Docker
- for ElasticBeanstalk: to enable the X-Ray daemon
- Instrumentation means the measure of product’s performance, diagnose errors, and to write trace information
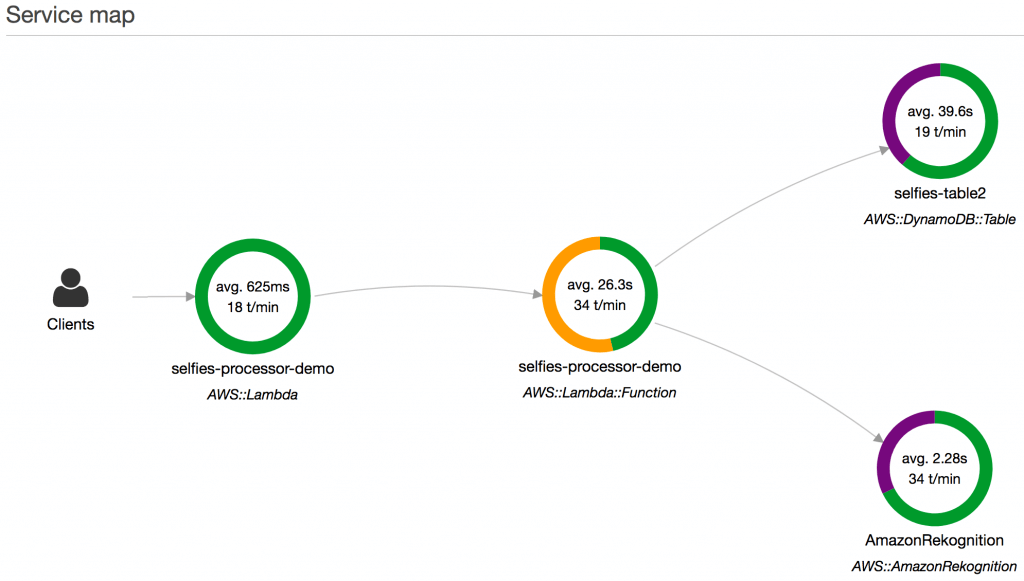
- AWS X-Ray receives data from services as segments. X-Ray then groups segments that have a common request into traces. X-Ray processes the traces to generate a service graph that provides a visual representation of your application.
- segments/subsegments -> traces -> service graph
- Segments: each application / service will send them
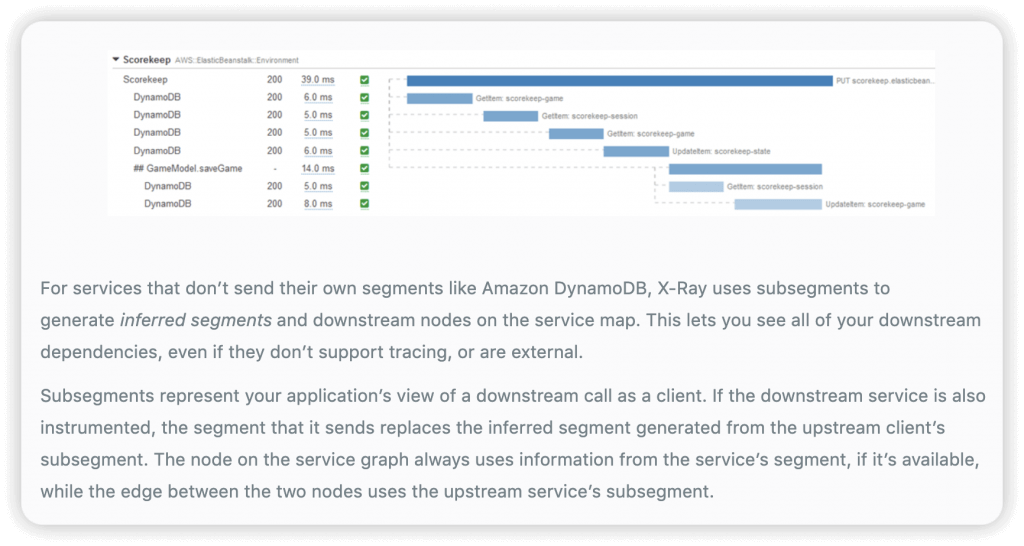
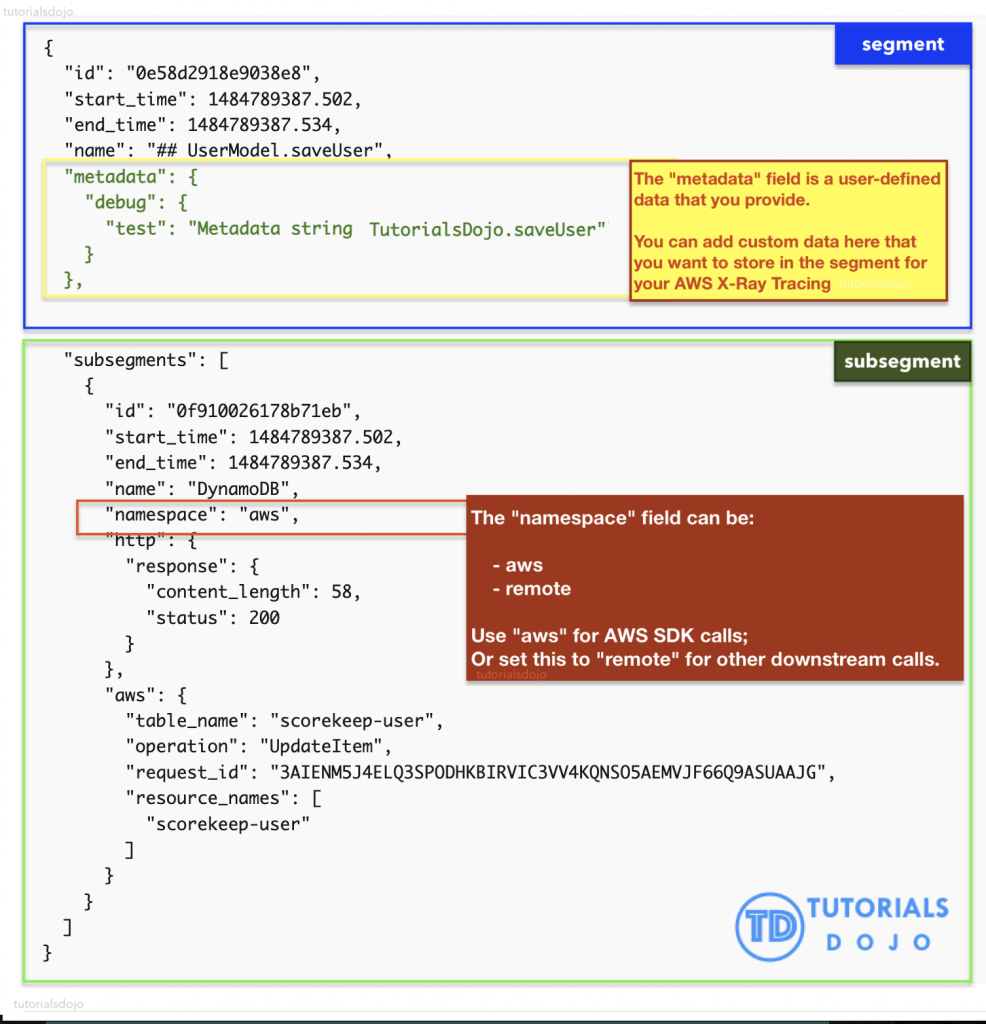
- Subsegments: if you need more details in your segment, especially for DynanmoDB.
- Trace: segments collected together to form an end-to-end trace
- A trace segment is just a JSON representation of a request that your application serves.
- Sampling: decrease the amount of requests sent to X-Ray, reduce cost
- (default) 1st request each second (aka reservoir: 1), and then 5% of additional requests (aka rate: 0.05)
- Annotations: Key Value pairs used to index traces (for search) and use with filters
- Metadata: “EXTRA” Key Value pairs, not indexed, not used for searching
- AWS X-Ray receives data from services as segments. X-Ray then groups segments that have a common request into traces. X-Ray processes the traces to generate a service graph that provides a visual representation of your application.
- A subset of segment fields are indexed by X-Ray for use with filter expressions. You can search for segments associated with specific information in the X-Ray console or by using the GetTraceSummaries API.
- X-Ray APIs Policy
- AWSXrayWriteOnlyAccess
- PutTraceSegments
- PutTelemetryRecords
- GetSamplingRules
- GetSamplingTargets
- GetSamplingStatisticSummaries
- AWSXrayReadOnlyAccess – grant console access
- GetServiceGraph
- BatchGetTraces
- GetTraceSummaries
- GetTraceGraph
- AWSXRayDaemonWriteAccess
- AWSXrayFullAccess – Read + Write + configure encryption key settings and sampling rules
- AWSXrayWriteOnlyAccess
- APIs
- GetTraceSummaries – trace summaries, as a list of trace IDs of the application (also with annotations)
- BatchGetTraces – full traces, retrieve the list of traces (ie activity events)
- GetGroup – retrieves the group resource details.
- GetServiceGraph – shows which services process the incoming requests, including the downstream services that they call as a result.
- If a load balancer or other intermediary forwards a request to your application, X-Ray takes the client IP from the X-Forwarded-For header in the request instead of from the source IP in the IP packet.
- Insights
- records performance outliers and tracks their impact until they are resolved
- issues can be identified where they are occurring and what is causing them, and be triaged with the appropriate severity. Insights notifications are sent as the issue changes over time and can be integrated with your monitoring and alerting solution using Amazon EventBridge.
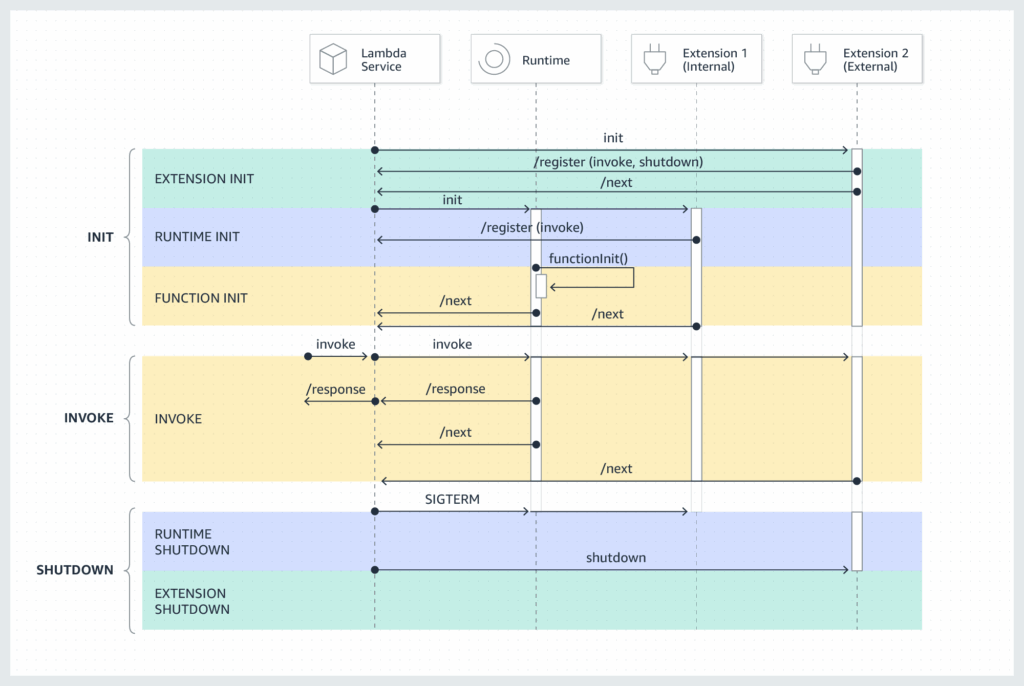
- With an external AWS Lambda Extension using the telemetry API and X-Ray active tracing enabled, workflows are broken down into segments corresponding to the unit of work each Lambda function does. This can even be further broken down into subsegments by instrumenting calls to dependencies and related work, such as when a Lambda function requires data from DynamoDB and additional logic to process the response.
- Lambda extensions come in two flavors: external and internal. The main difference is that an external extension runs in a separate process and is allowed to run longer to clean up after the Lambda function terminates, whereas an internal one runs in-process.
- Although Cloudwatch Logs insights and X-Ray insights both analyze and surface emergent issues from data, they do it on very different types of data — logs and traces, respectively. As logs do not have graph-like relationships of trace segments/spans, they may require more work or data to surface the same issues.
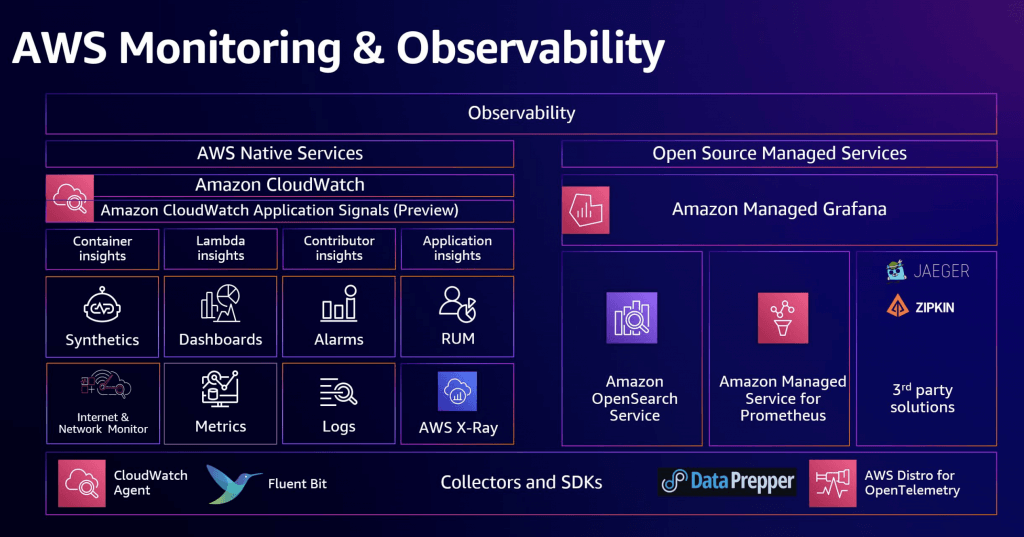
Amazon Managed Grafana
- a fully managed and secure data visualization service that you can use to instantly query, correlate, and visualize operational metrics, logs, and traces
| Use case | What is it optimized for? | Monitoring and observability services |
|---|---|---|
| Monitoring and alerting | These services are optimized to provide real-time visibility, proactive issue detection, resource optimization, and efficient incident response, contributing to overall application and infrastructure health. | – Amazon CloudWatch – Amazon CloudWatch Logs – Amazon EventBridge |
| Application performance monitoring | These services provide comprehensive insights into application behavior, offer tools for identifying and resolving performance bottlenecks, aid in efficient troubleshooting, and contribute to delivering modern user experiences across distributed and web applications. | – Amazon CloudWatch Application Signals – Amazon Managed Service for Prometheus – AWS X-Ray – Amazon CloudWatch Synthetics |
| Infrastructure observability | These services provide a holistic view of your cloud resources, helping you make more informed decisions about resource utilization, performance optimization, and cost-efficiency. | – Amazon CloudWatch Metrics – Amazon CloudWatch Container Insights |
| Logging and analysis | These services help you efficiently manage and analyze log data, troubleshoot, detect anomalies, support security, meeting compliance requirements, and get actionable insights into your applications and infrastructure. | – Amazon Cloudwatch Logs Insights – Amazon CloudWatch Logs Anomaly Detection – Amazon Managed Grafana – Amazon OpenSearch Service – Amazon Kinesis Data Streams |
| Security and compliance monitoring | Optimized to provide a robust security framework, enabling proactive threat detection, continuous monitoring, compliance tracking, and audit capabilities to help safeguard your AWS resources and maintain a secure and compliant environment. | – Amazon GuardDuty – AWS Config – AWS CloudTrail |
| Network monitoring | These services provide visibility into network traffic, enhance security by detecting and preventing threats, enable efficient network traffic management, and support incident response activities. | – Amazon CloudWatch – Network Monitor – Amazon CloudWatch Internet Monitor – Amazon VPC Flow Logs – AWS Network Firewall |
| Distributed tracing | These services provide a comprehensive view of the interactions and dependencies within your distributed applications. They enable you to diagnose performance bottlenecks, optimize application performance, and support the smooth functioning of complex systems by offering insights into how different parts of your application communicate and interact. | – AWS Distro for OpenTelemetry – AWS X-Ray – Amazon CloudWatch Application Signals (Preview) |
| Hybrid and multicloud observability | Maintain reliable operations, provide modern digital experiences for your customers, and get help to meet service level objectives and performance commitments. | – Amazon CloudWatch (hybrid and multicloud support) |
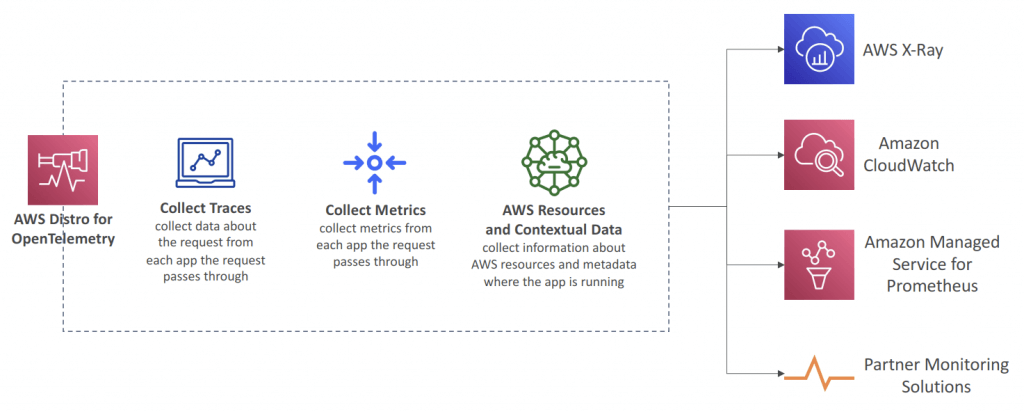
AWS Distro for OpenTelemetry
- (opensource) provides a single set of APIs, libraries, agents, and collector services
- collects distributed traces and metrics from applications
- also collects metadata from AWS resources and services
- Auto-instrumentation Agents
- Send traces and metrics to multiple AWS services and partner solutions
- X-Ray, CloudWatch, Prometheus…
- Instrument your apps running on AWS (e.g., EC2, ECS, EKS, Fargate, Lambda) as well as on-premises
- Migrate from X-Ray to AWS Distro for Temeletry if wants to standardize with open-source APIs from Telemetry or send traces to multiple destinations (AWS and partners) simultaneously
AWS Athena
- Serverless query service to analyze data stored in Amazon S3
- Uses standard SQL language to query the files (built on Presto)
- Supports CSV, JSON, ORC, Avro, and Parquet
- Commonly used with Amazon Quicksight for reporting/dashboards
- Use cases: Business intelligence / analytics / reporting, analyze & query VPC Flow Logs, ELB Logs, CloudTrail trails, etc…
- Performance Improvement
- Use columnar data for cost-savings (less scan)
- Apache Parquet or ORC is recommended
- Use Glue to convert your data to Parquet or ORC
- Compress data for smaller retrievals (bzip2, gzip, lz4, snappy, zlip, zstd…)
- Partition datasets in S3 for easy querying on virtual columns
- s3://yourBucket/pathToTable
- /<PARTITION_COLUMN_NAME>=<VALUE>
- /<PARTITION_COLUMN_NAME>=<VALUE>
- /<PARTITION_COLUMN_NAME>=<VALUE>
- /etc…
- Example: s3://athena-examples/flight/parquet/year=1991/month=1/day=1/
- s3://yourBucket/pathToTable
- Use larger files (> 128 MB) to minimize overhead
- Use columnar data for cost-savings (less scan)
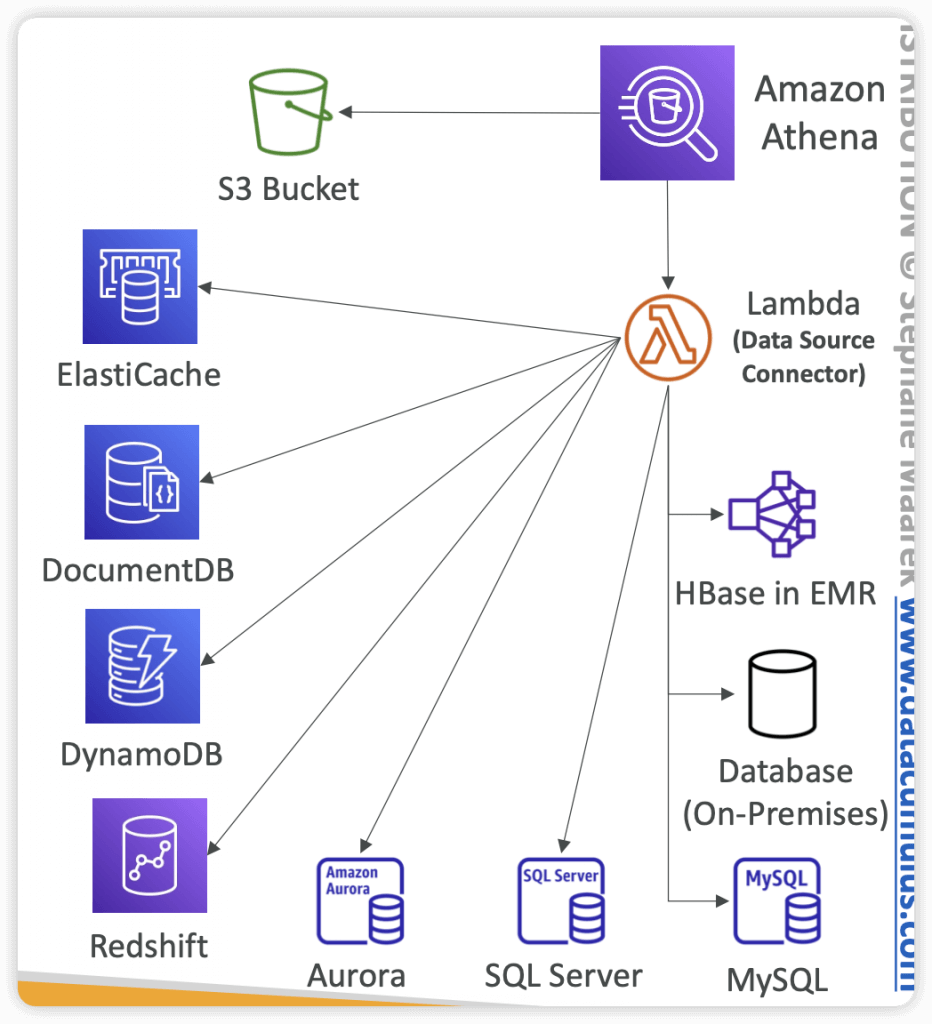
- Federated Query
- Allows you to run SQL queries across data stored in relational, non-relational, object, and custom data sources (AWS or on-premises)
- Uses Data Source Connectors that run on AWS Lambda to run Federated Queries (e.g., CloudWatch Logs, DynamoDB, RDS, …)
- Store the results back in Amazon S3
Logs used in AWS
- Application Logs
- Logs that are produced by your application code
- Contains custom log messages, stack traces, and so on
- Written to a local file on the filesystem
- Usually streamed to CloudWatch Logs using a CloudWatch Agent on EC2
- If using Lambda, direct integration with CloudWatch Logs
- If using ECS or Fargate, direct integration with CloudWatch Logs
- If using Elastic Beanstalk, direct integration with CloudWatch Logs
- Operating System Logs (Event Logs, System Logs)
- Logs that are generated by your operating system (EC2 or on-premise instance)
- Informing you of system behavior (ex: /var/log/messages or /var/log/auth.log)
- Usually streamed to CloudWatch Logs using a CloudWatch Agent
- Access Logs
- list of all the requests for individual files that people have requested from a website
- Example for httpd: /var/log/apache/access.log
- Usually for load balancers, proxies, web servers, etc…
- AWS provides some access logs
- AWS Managed Logs
- Load Balancer Access Logs (ALB, NLB, CLB) => to S3
- Access logs for your Load Balancers
- CloudTrail Logs => to S3 and CloudWatch Logs
- Logs for API calls made within your account
- VPC Flow Logs => to S3 and CloudWatch Logs
- Information about IP traffic going to and from network interfaces in yourVPC
- Route 53 Access Logs => to CloudWatch Logs
- Log information about the queries that Route 53 receives
- S3 Access Logs => to S3
- Server access logging provides detailed records for the requests that are made to a bucket
- CloudFront Access Logs => to S3
- Detailed information about every user request that CloudFront receives
- Load Balancer Access Logs (ALB, NLB, CLB) => to S3
- CloudWatch Logs for EC2
- By default, no logs from your EC2 machine will go to CloudWatch
- You need to run a CloudWatch agent on EC2 to push the log files you want
- Make sure IAM permissions are correct
- The CloudWatch log agent can be setup on-premises too
- [ 🧐QUESTION🧐 ] ensure that logs from all existing and future Amazon CloudWatch Logs log groups are automatically forwarded to a dedicated Amazon S3 bucket in a central logging account
- Configure subscription filters on all log groups to stream data to Data Firehose. Set up an Amazon Data Firehose stream to target the S3 bucket in the logging account. Deploy an AWS Lambda function to invoke the
PutSubscriptionFilterAPI for new log groups triggered by an Amazon EventBridge rule forCreateLogGroupevents. - S3 Batch Operations is primarily designed to perform operations on existing objects in an S3 bucket, not to import data from other AWS services like CloudWatch Logs. Additionally, it would require manually configuring the job for each log group, which goes against the requirement of automatically forwarding logs from all existing and future log groups.
- AWS DataSync is typically designed for transferring data between on-premises storage and AWS storage services, or between AWS storage services. It is not intended for transferring data from other AWS services like CloudWatch Logs to S3.
- CloudWatch Logs cannot directly subscribe an S3 bucket to receive logs. Subscription filters in CloudWatch Logs are only designed to work with AWS services like Data Firehose or Lambda, not directly with S3.
- Configure subscription filters on all log groups to stream data to Data Firehose. Set up an Amazon Data Firehose stream to target the S3 bucket in the logging account. Deploy an AWS Lambda function to invoke the